Prometheus Remote Write
Created:2024-11-05 Last Modified:2024-11-05
This document was translated by ChatGPT
#1. Function
By using Prometheus Remote Write, you can export the metrics generated by DeepFlow to external platforms. This allows you to continue leveraging the Prometheus ecosystem, such as viewing metrics and configuring alerts through Prometheus.
#2. Introduction to Metrics
In DeepFlow, metrics can be categorized into two types:
- Application performance metrics: See details here
- Corresponds to the
flow_metrics.application*tables in ClickHouse
- Corresponds to the
- Network performance metrics: See details here
- Corresponds to the
flow_metrics.network*tables in ClickHouse
- Corresponds to the
#3. Prometheus Remote Write
For the protocol format, refer to Prometheus’s pb file definition: https://github.com/prometheus/prometheus/blob/main/prompb/remote.proto
#4. DeepFlow Server Configuration Guide
Add the following configuration under the Server settings to enable metric export:
ingester:
  exporters:
    - protocol: prometheus
      enabled: true
      endpoints: [http://127.0.0.1:9091/receive, http://1.1.1.1:9091/receive]
      data-sources:
        - flow_metrics.application_map.1s
      # - flow_metrics.application_map.1m
      # - flow_metrics.application.1s
      # - flow_metrics.application.1m
      # - flow_metrics.network_map.1s
      # - flow_metrics.network_map.1m
      # - flow_metrics.network.1s
      # - flow_metrics.network.1m
      queue-count: 4
      queue-size: 100000
      batch-size: 1024
      flush-timeout: 10
      tag-filters:
      export-fields:
        - $tag
        - $metrics
      extra-headers:
        key1: value1
        key2: value2
      export-empty-tag: false
      export-empty-metrics-disabled: false
      enum-translate-to-name-disabled: false
      universal-tag-translate-to-name-disabled: false
1
2
3
4
5
6
7
8
9
10
11
12
13
14
15
16
17
18
19
20
21
22
23
24
25
26
27
28
29
2
3
4
5
6
7
8
9
10
11
12
13
14
15
16
17
18
19
20
21
22
23
24
25
26
27
28
29
#5. Detailed Parameter Description
| Field | Type | Required | Description |
|---|---|---|---|
| protocol | strings | Yes | Fixed value prometheus |
| data-sources | strings | Yes | Use flow_metrics.* data, flow_log.* and other data types are not supported |
| endpoints | strings | Yes | Remote receiving addresses for remote write; randomly selects one that can send successfully |
| batch-size | int | No | Batch size; when this value is reached, data is sent in batches. Default: 1024 |
| extra-headers | map | No | HTTP header fields for remote requests; for example, tokens for authentication can be added here |
| export-fields | strings | Yes | $k8s.label is not supported; recommended configuration: [$tag, $metrics] |
See detailed configuration reference
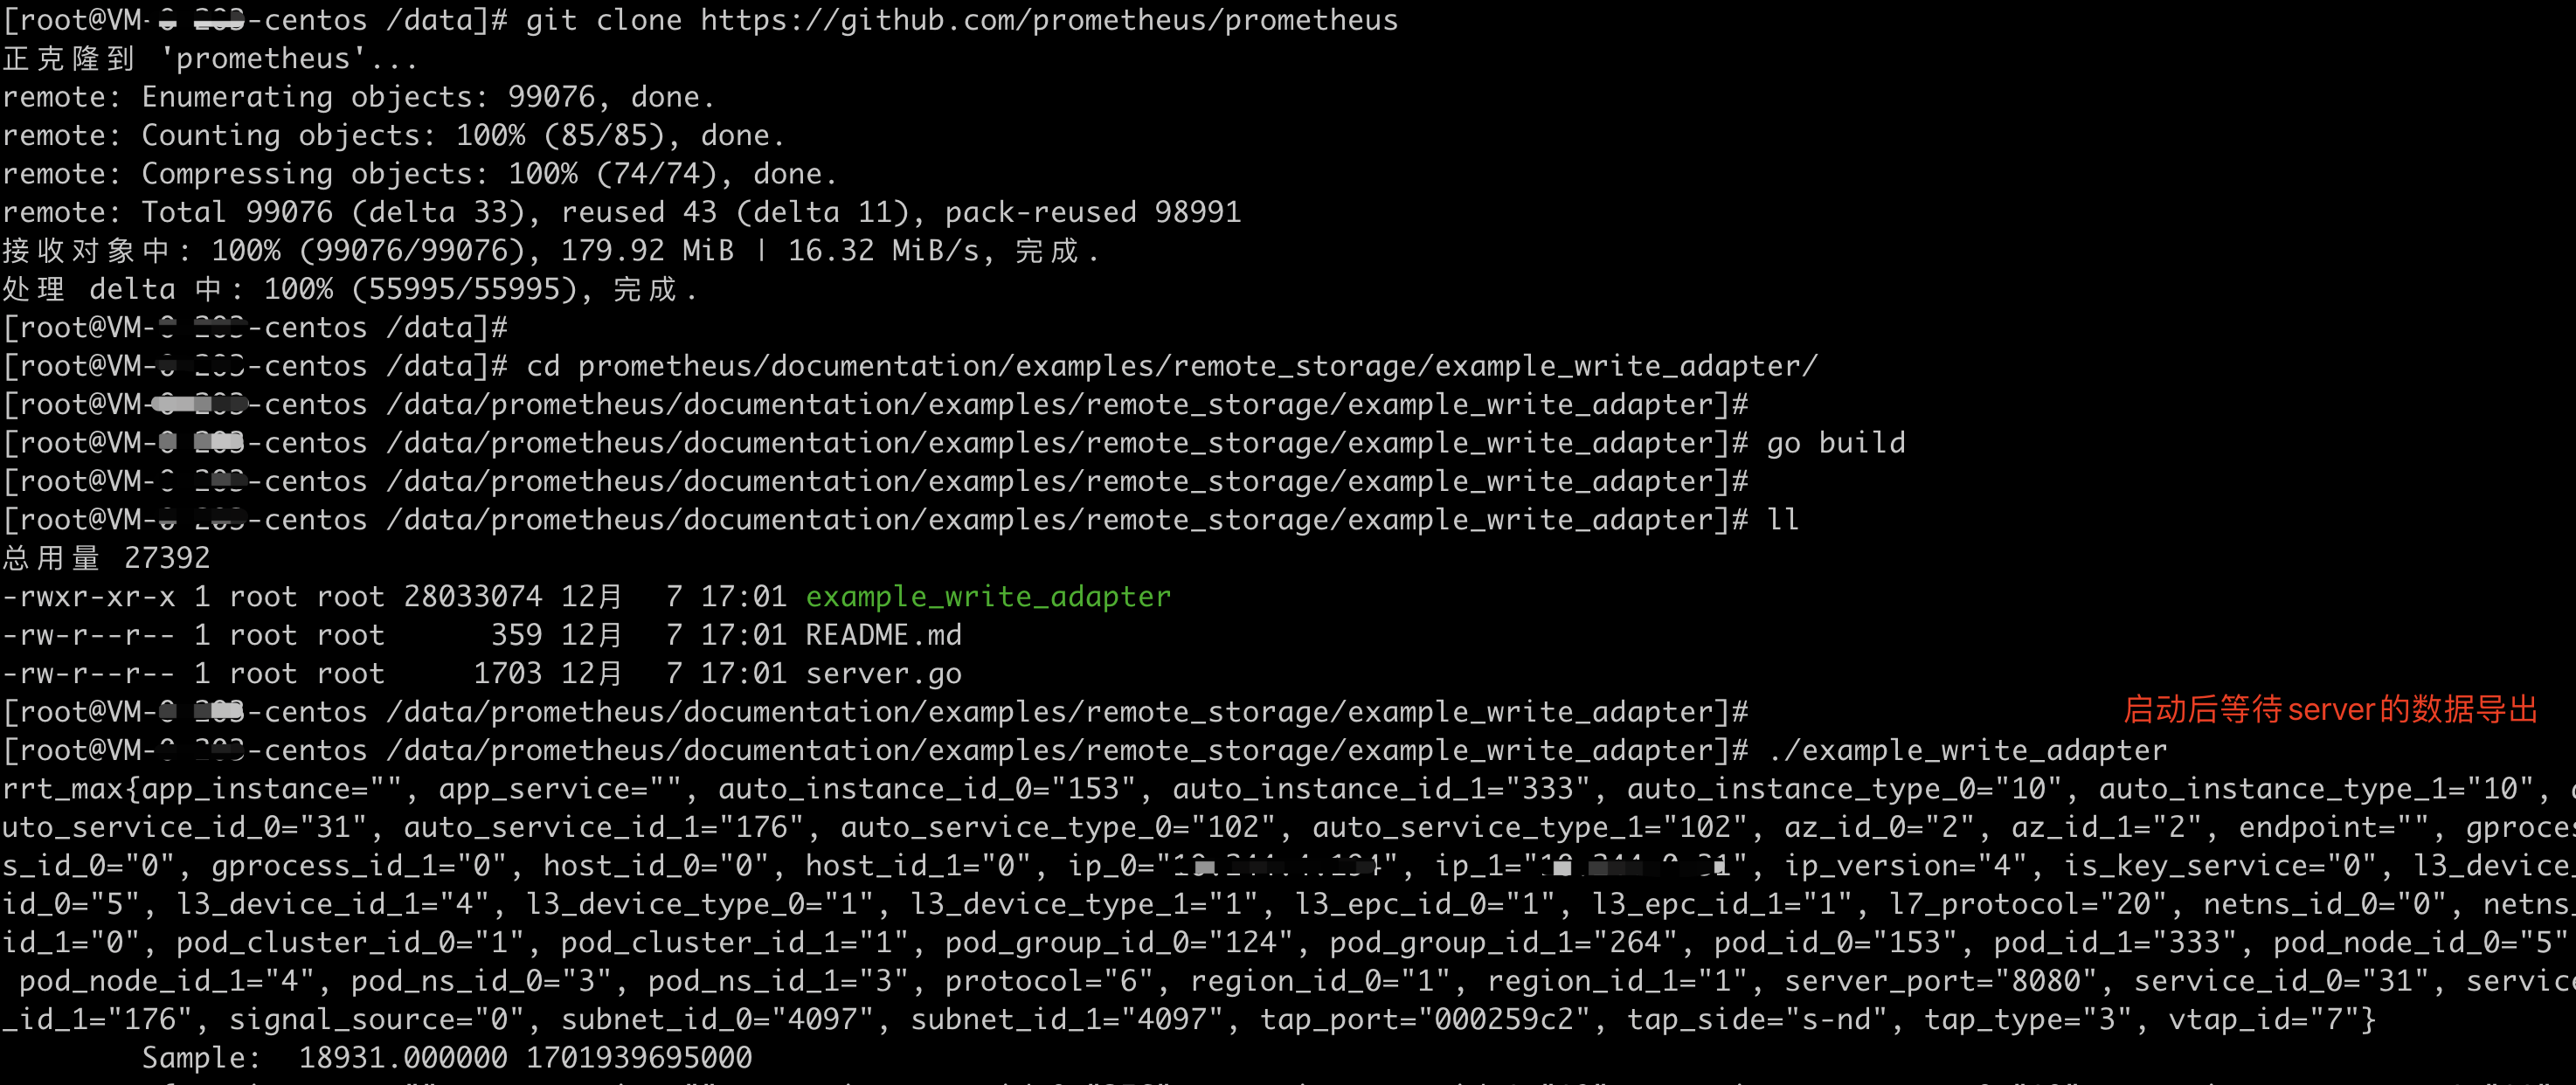
#6. Quick Demo
Set up a RemoteWrite receiver; you can refer to this Prometheus demo (opens new window)
Add the configuration:
exporters:
  - protocol: prometheus
    data-sources:
      - flow_metrics.application_map.1s
    endpoints: [http://localhost:1234/receive]
    export-fields:
      - $tag
      - $metrics
1
2
3
4
5
6
7
8
2
3
4
5
6
7
8
- Restart the DeepFlow Server, and after a short while, you should see output results like the following on the RemoteWrite receiver: