


 Table
Table
This document was translated by ChatGPT
#1. Table
Tables are used to display detailed information of structured data. DeepFlow tables are divided into two types: Aggregate Table and Detail Table.
#1.1 Aggregate Table
Aggregate tables support querying data from multiple tables of the same type at the same time, for example, Service Metrics, Path Metrics, or xx Logs.

01-Aggregate Table
- ① Query Area: Basic chart operation. For usage details, please refer to Traffic Topology - Modify Metrics section.
- ② Modify Metrics: Basic chart operation. For usage details, please refer to Traffic Topology - Overview section.
- Long press and drag data to map the data order to the table.
- ③ Settings: Basic chart operation. For usage details, please refer to Traffic Topology - Settings section.
- ④ Delete: A capability in the
Dashboard. For usage details, please refer to Traffic Topology - Overview section.
#1.1.1 Edit
The edit panel of an aggregate table consists of three parts: ① Chart, ② Search Criteria, and ③ Configuration.

02-Edit
- ① Chart: The chart is drawn based on
② Search Criteriaand③ Configuration. - ② Search Criteria: For usage of search criteria, please refer to Search section.
- ③ Configuration: Supports quick switching of chart types, and configuring chart styles and related functions.
- Switch Chart Type: Basic chart function. For usage details, please refer to Line Chart section.
- Common Configurations: Rich functions to set chart styles.
- Chart Info: Basic chart function. For usage details, please refer to Line Chart section.
- Color: Set the basic color for chart text or background.
- Note: Only effective for columns with
Column Settings - Colorenabled.
- Note: Only effective for columns with
- Column Settings: Supports setting column color, alignment, value display, etc.
- Color: Choose the coloring target for the configured color — none, text, or background.
- Column Alignment: Choose column alignment — left, center, or right.
- Value Mapping: Match specified column values in three ways and replace them with custom text.
- Text: Match by string.
- Range: Match by numeric range.
- Regular Expression: Match by regular expression.
- Note: Value mapping priority is
Text > Range = Regular Expression. When conditions have the same priority, the one higher in the list takes effect.
- Threshold: Set a numeric range. Data within the range will display specified colors for text/background.
- Unit: Set the unit for the metric.
- Alias: Set an alias for the metric.
- Advanced Configurations:
- Cell: Supports configuring the table copy function.
- Copy Function: Enable or disable the ability to copy table content.
- Copy Content: Choose the data content to copy.
- Copy Data: Only copy the data content of the current cell, i.e.,
value. - Positive Filter Condition: Copy content in the format
key: value. You can paste it into the page search bar, which will quickly recognize it as asearch tagfor querying. - Negative Filter Condition: Copy content in the format
key!: value. You can paste it into the page search bar, which will quickly recognize it as asearch tagfor querying.- For usage details of search tags, please refer to Service Search Box section.
- Copy Data: Only copy the data content of the current cell, i.e.,
- Table Settings: Supports setting the table border and header.
- Cell: Supports configuring the table copy function.
#1.2 Detail Table
Detail tables only support querying a single type of log data, for example, flow logs or call logs.
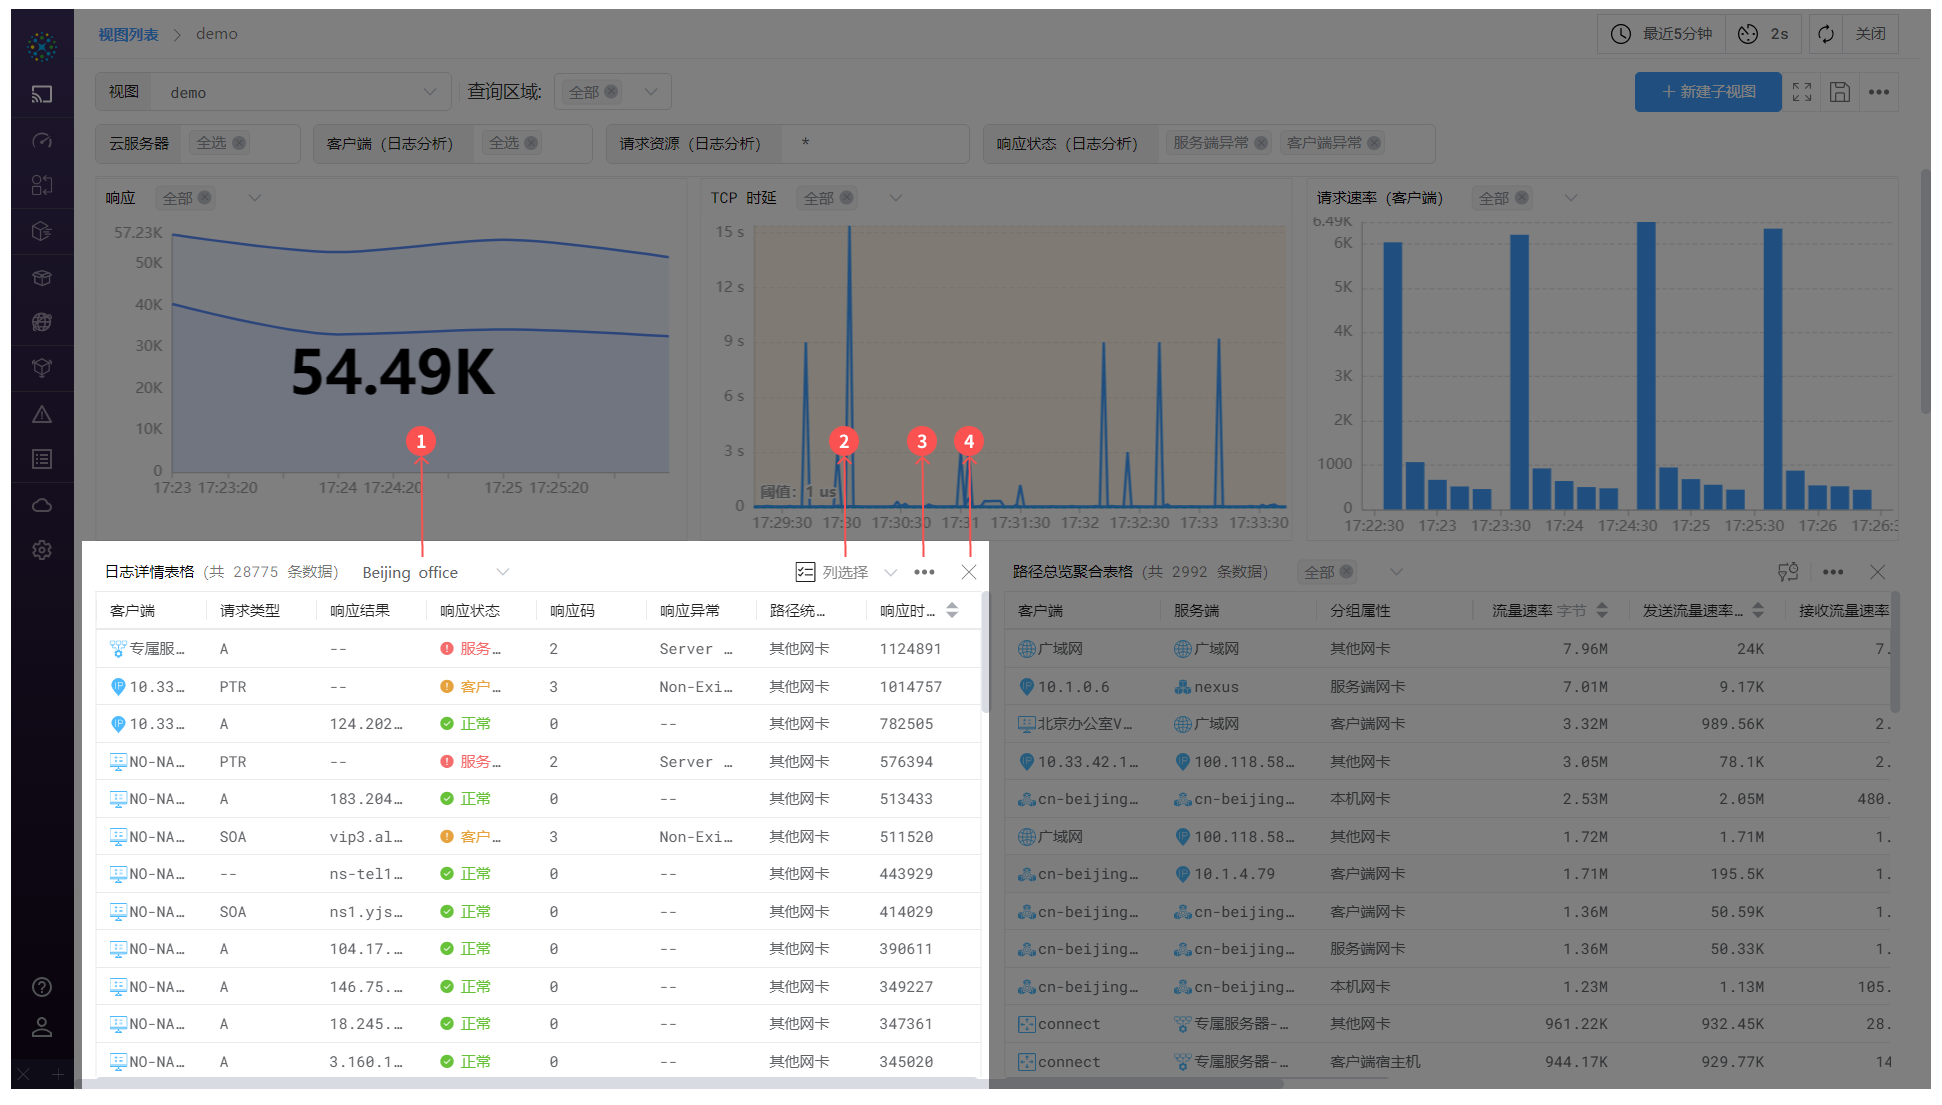
03-Detail Table
- ① Query Area: Basic chart operation. For usage details, please refer to Traffic Topology - Modify Metrics section.
- ② Column Selection: Supports searching, adding, and deleting column options available in the current table.
- Long press and drag data to map the data order to the table.
- ③ Settings: Basic chart operation. For usage details, please refer to Traffic Topology - Settings section.
- ④ Delete: A capability in the
Dashboard. For usage details, please refer to Traffic Topology - Overview section.
#1.2.1 Edit
The edit panel of a detail table consists of three parts: ① Chart, ② Search Criteria, and ③ Configuration.

04-Edit
- ① Chart: The chart is drawn based on
② Search Criteriaand③ Configuration. - ② Search Criteria: For usage of search criteria, please refer to Search section.
Note: Detail tables do not support adding multiple query conditions.
- ③ Configuration: For usage details, please refer to [Aggregate Table - Edit] section.