


 Reducing Storage Overhead
This document was translated by ChatGPT
This article explains how to configure DeepFlow to reduce ClickHouse storage overhead.
#1. Overview of Configuration Options
Before diving into specific configuration items, let’s first look at the main types of data collected by the DeepFlow Agent. From the perspective of databases and tables in ClickHouse, the data mainly falls into the following categories:
flow_log.l4_flow_log: Flow logs. TCP/UDP five-tuple flow logs calculated from cBPF traffic data. Each flow log contains packet header five-tuple fields, tag fields, and performance metrics, consuming about 150 bytes of storage on average.flow_log.l7_flow_log: Call logs. Application protocol call logs (HTTP/gRPC/MySQL, etc.) calculated from cBPF traffic data and eBPF function call data. Each call log contains key request/response fields, tag fields, and performance metrics, consuming about 70 bytes of storage on average, depending mainly on the length of header fields. For details on stored header fields for various application protocols, see the documentation.flow_metrics: Metrics data. Metrics aggregated from flow logs and call logs, by default generated at 1m and 1s time resolutions. Since these metrics are aggregated, their volume is small, typically consuming only about 1/10 of the storage space of flow logs or call logs.event.perf_event: Performance events. Currently stores process file read/write events, with each event containing process name, file name, read/write performance metrics, etc., consuming about 80 bytes per event.profile: Continuous profiling. Stores function call stacks for processes with continuous profiling enabled. By default, only the deepflow-agent and deepflow-server processes have eBPF On-CPU Profile enabled.
DeepFlow offers a wide range of configurations to reduce ClickHouse storage overhead, summarized in the diagram below.
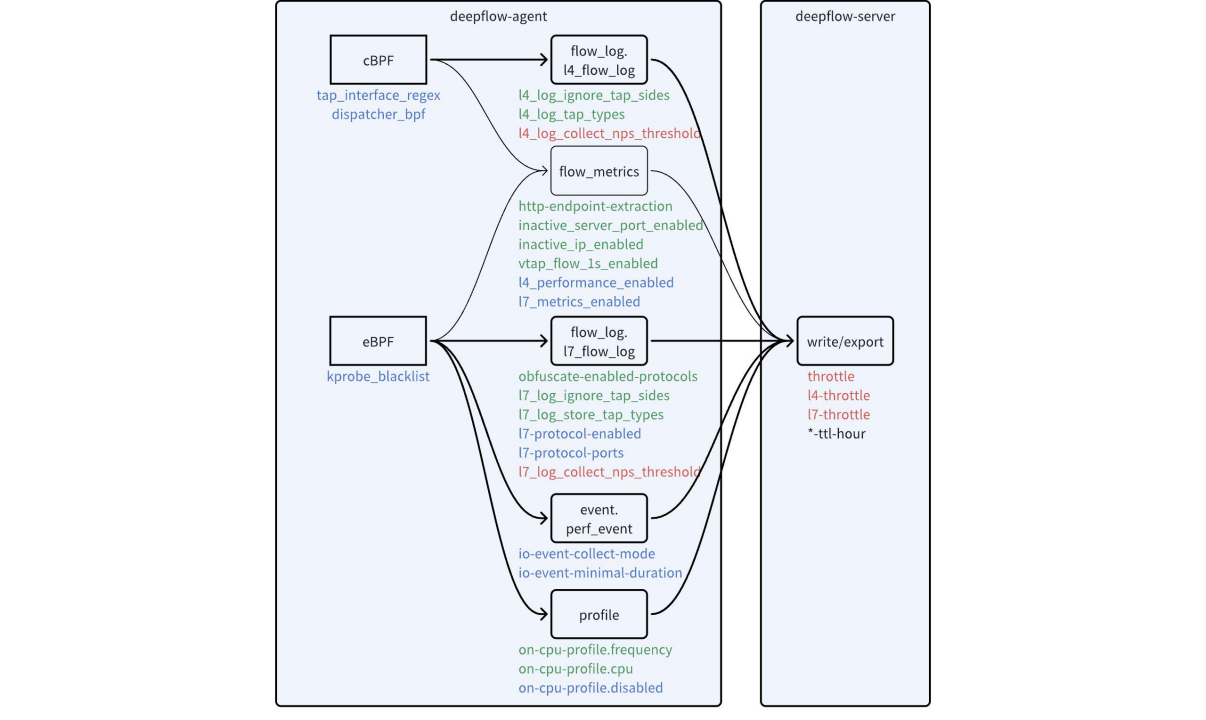
Configuration options to reduce data volume
The configuration parameters in the diagram can be categorized by purpose into four types:
- Black: Set data retention periods. Different types of data usually require different retention periods.
- Green: Reduce data granularity. Adjusting these settings can change the granularity of various data types, directly reducing storage pressure.
- Blue: Disable unneeded data. Adjusting these settings can disable features you don’t care about or filter out traffic you don’t care about, thereby reducing storage pressure.
- Red: Set overload protection thresholds. Agents and servers expose rate limit settings for data collection and storage to protect themselves from overload, preventing excessive data collection and writes.
#2. Estimating the Effect Before Making Changes
Before adjusting configurations, you should check the storage consumption of the relevant data in ClickHouse to estimate the potential benefits. The following ClickHouse commands can help you assess the storage overhead of specific tables.
View the row count and space usage of all tables to identify which ones consume the most storage:
WITH sum(bytes_on_disk) AS size SELECT database, table, formatReadableSize(sum(data_uncompressed_bytes)) AS "压缩前总大小", formatReadableSize(sum(bytes_on_disk)) AS "压缩后总大小", sum(rows) AS "总行数", sum(data_uncompressed_bytes)/sum(rows) AS "压缩前平均每行长度", sum(bytes_on_disk)/sum(rows) AS "压缩后平均每行长度" FROM system.parts GROUP BY database, table ORDER BY size DESC;

WITH sum(bytes_on_disk) AS size
SELECT
    database,
    table,
    formatReadableSize(sum(data_uncompressed_bytes)) AS `压缩前总大小`,
    formatReadableSize(sum(bytes_on_disk)) AS `压缩后总大小`,
    sum(rows) AS `总行数`,
    sum(data_uncompressed_bytes) / sum(rows) AS `压缩前平均每行长度`,
    sum(bytes_on_disk) / sum(rows) AS `压缩后平均每行长度`
FROM system.parts
GROUP BY
    database,
    table
ORDER BY size DESC

┌─database────────┬─table────────────────────────────────────┬─压缩前总大小─┬─压缩后总大小─┬────总行数─┬─压缩前平均每行长度─┬──压缩后平均每行长度─┐
│ flow_log        │ l7_flow_log_local                        │ 16.58 GiB    │ 3.15 GiB     │  47231817 │ 377.02479955408023 │   71.69953315579623 │
│ flow_log        │ l4_flow_log_local                        │ 4.84 GiB     │ 1.51 GiB     │  10487780 │ 495.46614078479905 │  154.46138525026268 │
│ profile         │ in_process_local                         │ 2.24 GiB     │ 349.19 MiB   │  10325238 │  233.1437255974148 │   35.46215912892274 │
│ flow_metrics    │ network_map.1s_local             │ 1.95 GiB     │ 261.58 MiB   │   5267001 │ 398.20784256543715 │   52.07621016210174 │
│ flow_metrics    │ network.1s_local                  │ 1.01 GiB     │ 159.70 MiB   │   3027870 │ 357.85661273436443 │   55.30619544432225 │
│ flow_metrics    │ application.1s_local                   │ 932.36 MiB   │ 129.11 MiB   │   8225431 │ 118.85691983799998 │  16.459093876053426 │
│ deepflow_system │ deepflow_system_local                    │ 1.55 GiB     │ 117.64 MiB   │  18478240 │  89.79716217561845 │   6.675736920832287 │
│ flow_metrics    │ application_map.1s_local              │ 691.41 MiB   │ 65.07 MiB    │   4128212 │  175.6193790435181 │   16.52821560520632 │
│ flow_metrics    │ network_map.1m_local             │ 331.22 MiB   │ 57.66 MiB    │    818085 │  424.5371263377277 │   73.90728347298875 │
│ flow_metrics    │ application_map.1m_local              │ 228.35 MiB   │ 28.72 MiB    │   1435956 │ 166.75001462440352 │  20.973729000052927 │
│ flow_metrics    │ network.1m_local                  │ 121.96 MiB   │ 27.08 MiB    │    328060 │  389.8104432116076 │   86.55356946899957 │
│ flow_metrics    │ application.1m_local                   │ 97.90 MiB    │ 16.84 MiB    │    870320 │ 117.95215897600882 │  20.283444020590128 │
│ event           │ perf_event_local                         │ 2.84 MiB     │ 1.24 MiB     │     16543 │  180.1239194825606 │   78.70126337423683 │
└─────────────────┴──────────────────────────────────────────┴──────────────┴──────────────┴───────────┴────────────────────┴─────────────────────┘
2
3
4
5
6
7
8
9
10
11
12
13
14
15
16
17
18
19
20
21
22
23
24
25
26
27
28
29
30
31
32
Check the daily space usage of a specific table, e.g., l7_flow_log, to evaluate how to set its retention period:
WITH sum(bytes_on_disk) AS size SELECT SUBSTRING(partition, 1, 10) AS date, formatReadableSize(sum(data_uncompressed_bytes)) AS "压缩前总大小", formatReadableSize(sum(bytes_on_disk)) AS "压缩后总大小", sum(rows) AS "总行数", sum(data_uncompressed_bytes)/sum(rows) AS "压缩前平均每行长度", sum(bytes_on_disk)/sum(rows) AS "压缩后平均每行长度" FROM system.parts WHERE `table` = 'l7_flow_log_local' GROUP BY date ORDER BY date DESC;

WITH sum(bytes_on_disk) AS size
SELECT
    substring(partition, 1, 10) AS date,
    formatReadableSize(sum(data_uncompressed_bytes)) AS `压缩前总大小`,
    formatReadableSize(sum(bytes_on_disk)) AS `压缩后总大小`,
    sum(rows) AS `总行数`,
    sum(data_uncompressed_bytes) / sum(rows) AS `压缩前平均每行长度`,
    sum(bytes_on_disk) / sum(rows) AS `压缩后平均每行长度`
FROM system.parts
WHERE table = 'l7_flow_log_local'
GROUP BY date
ORDER BY date DESC

┌─date───────┬─压缩前总大小─┬─压缩后总大小─┬───总行数─┬─压缩前平均每行长度─┬─压缩后平均每行长度─┐
│ 2023-12-27 │ 3.50 GiB     │ 681.83 MiB   │ 10049374 │  374.3181802169966 │  71.14405494312382 │
│ 2023-12-26 │ 5.13 GiB     │ 1012.92 MiB  │ 14397814 │ 382.63502848418517 │  73.76948966002756 │
│ 2023-12-25 │ 5.73 GiB     │ 1.07 GiB     │ 16340447 │  376.4205308459432 │  70.36901530294735 │
│ 2023-12-24 │ 2.22 GiB     │ 436.62 MiB   │  6432796 │ 370.22603095139345 │  71.17070586413746 │
└────────────┴──────────────┴──────────────┴──────────┴────────────────────┴────────────────────┘
2
3
4
5
6
7
8
9
10
11
12
13
14
15
16
17
18
19
20
21
Analyze space usage by a specific field value. For example, check the row count for each application protocol (l7_protocol) in l7_flow_log and the average length of the request_resource field to decide whether to disable parsing for certain protocols:
SELECT dictGet(flow_tag.int_enum_map, 'name_zh', ('l7_protocol', toUInt64(l7_protocol))) AS "应用协议", count(0) AS "行数", sum(length(request_resource))/count(l7_protocol) AS "平均 request_resource 长度", sum(length(request_resource))/sum(if(request_resource !='', 1, 0)) AS "平均非空 request_resource 长度" FROM flow_log.l7_flow_log WHERE time>now()-86400 GROUP BY l7_protocol ORDER BY "行数" DESC;

SELECT
    dictGet(flow_tag.int_enum_map, 'name_zh', ('l7_protocol', toUInt64(l7_protocol))) AS `应用协议`,
    count(0) AS `行数`,
    sum(length(request_resource)) / count(l7_protocol) AS `平均 request_resource 长度`,
    sum(length(request_resource)) / sum(if(request_resource != '', 1, 0)) AS `平均非空 request_resource 长度`
FROM flow_log.l7_flow_log
WHERE time > (now() - 86400)
GROUP BY l7_protocol
ORDER BY `行数` DESC

┌─应用协议───┬─────行数─┬─平均 request_resource 长度─┬─平均非空 request_resource 长度─┐
│ HTTP       │ 15307526 │          50.94938901296003 │              51.16722749422727 │
│ MySQL      │ 12762197 │          67.32974729977919 │             103.38747090527679 │
│ DNS        │  9271394 │           41.6790123470106 │               41.6790123470106 │
│ HTTP2      │  4561075 │         0.9742264707333249 │             1.0020964209295697 │
│ TLS        │  3422769 │         14.613528403465148 │             23.354457466682167 │
│ Redis      │  2140668 │          89.61926931219601 │              92.19873624192489 │
│ gRPC       │   957471 │         13.709391720480307 │             23.696586596959204 │
│ N/A        │    79113 │                          0 │                            nan │
│ Custom     │     4802 │                          1 │                              1 │
│ PostgreSQL │     1125 │                     81.112 │                         81.112 │
│ MongoDB    │      108 │         1.3703703703703705 │                         2.3125 │
└────────────┴──────────┴────────────────────────────┴────────────────────────────────┘
2
3
4
5
6
7
8
9
10
11
12
13
14
15
16
17
18
19
20
21
22
23
24
25
Check the row count for each observation point (observation_point) in l7_flow_log to decide whether to disable call log collection at certain points:
SELECT observation_point, dictGet(flow_tag.string_enum_map, 'name_zh', ('observation_point', observation_point)) AS "观测点", count(0) AS "行数" FROM flow_log.l7_flow_log WHERE time>now()-86400 GROUP BY observation_point ORDER BY "行数" DESC;

SELECT
    observation_point,
    dictGet(flow_tag.string_enum_map, 'name_zh', ('observation_point', observation_point)) AS `观测点`,
    count(0) AS `行数`
FROM flow_log.l7_flow_log
WHERE time > (now() - 86400)
GROUP BY observation_point
ORDER BY `行数` DESC

┌─observation_point─┬─观测点─────────┬─────行数─┐
│ c                 │ 客户端网卡     │ 15034372 │
│ s                 │ 服务端网卡     │  9343403 │
│ c-p               │ 客户端进程     │  9179406 │
│ s-p               │ 服务端进程     │  5723075 │
│ rest              │ 其他网卡       │  3170534 │
│ s-nd              │ 服务端容器节点 │  2796958 │
│ c-nd              │ 客户端容器节点 │  2334083 │
│ local             │ 本机网卡       │  1365403 │
│ s-app             │ 服务端应用     │    89280 │
│ app               │ 应用           │    80079 │
│ s-gw              │ 网关到服务端   │       11 │
└───────────────────┴────────────────┴──────────┘
2
3
4
5
6
7
8
9
10
11
12
13
14
15
16
17
18
19
20
21
22
23
24
Analyze space usage by a specific field value. For example, check the row count for different durations in event.perf_event:
SELECT count(), min(duration) AS min_duration_us, max(duration) AS max_duration_us, toUInt64(duration/1000) AS ms FROM event.perf_event GROUP BY ms ORDER BY ms ASC

SELECT
    count(),
    min(duration) AS min_duration_us,
    max(duration) AS max_duration_us,
    toUInt64(duration / 1000) AS ms
FROM event.perf_event
GROUP BY ms
ORDER BY ms ASC

┌─count()─┬─min_duration_us─┬─max_duration_us─┬───ms─┐
│  233129 │            1000 │            1999 │    1 │
│    6912 │            2000 │            2999 │    2 │
│    1209 │            3000 │            3999 │    3 │
│     552 │            4000 │            4999 │    4 │
│     320 │            5002 │            5996 │    5 │
│     187 │            6000 │            6992 │    6 │
│     119 │            7030 │            7997 │    7 │
│     103 │            8003 │            8992 │    8 │
...
2
3
4
5
6
7
8
9
10
11
12
13
14
15
16
17
18
19
20
21
#3. Black: Setting Data Retention Periods
deepflow-server allows you to set retention periods for all tables. Search for the -ttl-hour option in server.yaml to set the retention period for specific tables as needed. Typically, you can set longer retention for metrics data (flow_metrics, prometheus, etc.) and shorter retention for log data (flow_log, etc.). Retention can be set with hourly precision.
In the Enterprise Edition, you can set retention periods directly in the DeepFlow UI. The Community Edition only supports setting retention for tables that have not yet been created, so to change the retention for an existing table, you must delete it in ClickHouse and restart deepflow-server.
#4. Green: Reducing Data Granularity
Let’s first look at the green configuration items, which help you trade off data granularity to reduce storage pressure.
For flow logs flow_log.l4_flow_log:
l4_log_ignore_tap_sides: Discard flow logs collected at certain observation points (observation_point). In a K8s container environment, DeepFlow collects flow logs from both virtual and physical NICs by default. For example, when Pod1 accesses Pod3, the same traffic is logged four times along the path. Setting this toc-ndands-nddiscards logs from physical NICs. See documentation for details on observation points.l4_log_tap_types: Discard flow logs collected at certainnetwork locations. When processing mirrored traffic from physical switches (Enterprise Edition), you can use this to drop logs from specific mirror locations. Setting to[-1]completely disables flow logs.
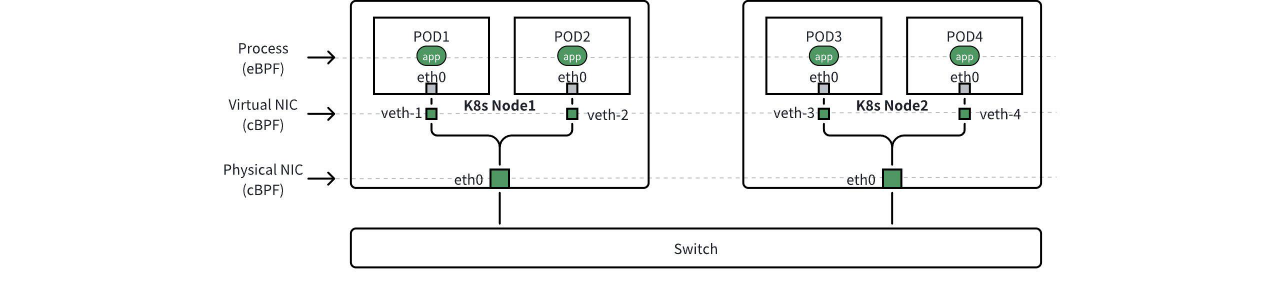
Observation points of data (observation_point)
For call logs flow_log.l7_flow_log:
obfuscate-enabled-protocols: Mask therequest_resourcefield in call logs by replacing variables with?. Currently supports MySQL, PostgreSQL, and Redis. Masking reduces field length and thus storage usage but increases deepflow-agent CPU usage.l7_log_ignore_tap_sides: Discard call logs collected at certain observation points. In K8s, DeepFlow collects call logs from application processes, virtual NICs, and physical NICs. Setting this toc-ndands-nddiscards logs from physical NICs.l7_log_tap_types: Discard call logs collected at certainnetwork locations. Setting to[-1]completely disables call logs and also disables distributed tracing.
Adjusting these settings for flow and call logs does not affect the accuracy of flow_metrics. For metrics data, although storage usage is small, there are also relevant settings:
http-endpoint-extration: Controls how HTTP endpoints are generated. For RPC protocols (e.g., gRPC/Dubbo), endpoints are clear from headers. For HTTP URIs, by default, the first two segments are used. Adjust this to avoid excessive endpoint values or insufficiently informative ones.inactive_server_port_enabled: Stores inactive TCP/UDP ports asserver_port = 0. Useful for reducing metric cardinality when port scanning traffic exists. Enabled by default.inactive_ip_enabled: Stores inactive IP addresses as0.0.0.0. Useful for reducing metric cardinality when IP scanning traffic exists. Enabled by default.vtap_flow_1s_enabled: Disables 1s granularity aggregation when high-resolution metrics are not needed. Enabled by default.
For continuous profiling profile:
on-cpu-profile.frequency: Adjusts function call stack sampling frequency. Default is 99 (about every 10ms). Lowering reduces data volume.on-cpu-profile.cpu: Controls whether to distinguish call stacks by CPU core. Default 0 (no distinction, lower storage). Setting to 1 prevents aggregation across cores.
#5. Blue: Disabling Unneeded Data
Next, the blue configuration items help disable unneeded features or filter out irrelevant traffic to reduce storage usage.
For call logs flow_log.l7_flow_log:
l7-protocol-enabled: Select which application protocols to parse. By default, all are enabled. Remove protocols like Kafka or Redis if not needed.l7-protocol-ports: Set the port list for parsing specific protocols. For example, DNS defaults to ports 53 and 5353, TLS to 443, others to all ports. Restricting ports for ambiguous protocols like Redis can prevent misparsing and dirty data.
For metrics data flow_metrics:
l4_performance_enabled: Disables calculation/storage of advanced network performance metrics (latency, performance, exceptions) innetwork_*tables. See documentation for details.l7_metrics_enabled: Disables calculation/storage of application performance metrics inapplication_*tables.
For performance events event.perf_event:
io-event-collect-mode: Adjusts the scope of file read/write event collection. 0 disables, 1 collects only within a Request lifecycle, 2 collects all. Default is 1.io-event-minimal-duration: Sets a duration threshold for recording events. Default is 1ms. Increasing reduces event count.
For continuous profiling profile:
on-cpu-profile.disabled: Completely disables continuous profiling.
Additionally, you can reduce data at the source:
tap_interface_regex: Controls which NICs to capture traffic from. Adjust to exclude certain virtual or physical NICs.capture_bpf: Uses BPF expressions to filter captured traffic. For example, set tonot port 9999to exclude monitoring traffic on port 9999.kprobe_blacklist: Sets a port blacklist for eBPF kprobe to filter (drop) socket data, reducing call log volume.
#6. Red: Setting Overload Protection Thresholds
Finally, the red configuration items. We want to avoid agents outputting excessive flow or call logs in extreme cases to prevent high bandwidth usage, and avoid excessive write loads on a single server to prevent ClickHouse overload. The following settings are available:
l4_log_collect_nps_threshold: Controls the maximum rate at which an agent sends flow logs. When exceeded, the agent drops logs. Monitordrop-in-throttleindeepflow_system.deepflow_agent_flow_aggrto track drops.l7_log_collect_nps_threshold: Controls the maximum rate at which an agent sends call logs. When exceeded, the agent drops logs. Monitorthrottle-dropindeepflow_system.deepflow_agent_l7_session_aggrto track drops.l4-throttle: Controls the maximum write rate of flow logs per server replica. 0 uses thethrottlevalue. When exceeded, the server drops logs. Monitordrop_countindeepflow_system.deepflow_server_ingester_decoder(filtermsg_type: l4_log) to track drops.l7-throttle: Controls the maximum write rate of call logs per server replica. 0 uses thethrottlevalue. When exceeded, the server drops logs. Monitordrop_countindeepflow_system.deepflow_server_ingester_decoder(filtermsg_type: l7_log) to track drops.