


 Service Topology
This document was translated by ChatGPT
#1. Service Topology
Displays the services defined by the user in Business Definition in a waterfall topology format.

01-Service Topology
- ① Business Switch Dropdown: Quickly switch between businesses, defaults to the first starred business
- ② Service Management: Click the button to enter the business details page
- ③ Modify Metrics: Supports showing/hiding metrics and setting the primary metric
- ④ Save: Supports saving the
time range,service topology position, andconfigurationof the service topology - ⑤ Settings: Supports functions such as
Edit,View API,Add to Dashboard, andReset- Reset: The service topology will be restored to its initial layout
- ⑥ Service Group: Consists of a
name row+box. For example, in the figure, Client, gcp-microservices-demo, DNS, and Redis are all independent service groups - ⑦ Path: Represents a path with actual data from client to server. Hover to view the TIP, click to view path details in the right sliding panel, see later sections for details
- ⑧ Service: Each block in the topology represents a service, consisting of a
name row+metrics. Hover to view the TIP, click to view service details in the right sliding panel, see later sections for details- Name Row: ICON represents the service type
- Metrics: Displays metrics according to the priority of Observation Points (s-xx > local > rest > app). When a metric exceeds the threshold, the name row and corresponding metric will be highlighted in red
- ⑨ Operation Set: Supports layout, connection, zoom, and other operations on the topology
- Layout: Enter manual layout mode, supports dragging
services. Click theSavebutton again to exit and save the layout position - Edit: Enter path editing mode, supports adding or deleting
paths. Click theEditbutton again to exit path editing mode- Add Path: Supports adding connections between
services/service groups of automatic grouping type, converting the connection into apath - Delete Path: Click the close button on the path to delete the corresponding
path
- Add Path: Supports adding connections between
- Zoom In/Out: Zoom in or out of the topology
- Mouse Wheel Zoom: When disabled, the topology size can only be controlled via the
Zoom In/Outbuttons
- Layout: Enter manual layout mode, supports dragging
#1.1 Right Sliding Panel
Clicking on a service or path will open the right sliding panel to view its detailed information. The right sliding panel consists of the upper Call Topology and the lower TABs.
#1.1.1 Call Topology
View the client and server of the selected service through the Call Topology, or view the selected path.

02-Call Topology
- ① Switch Grouping: View the call topology by *, auto_service, auto_instance, and Custom Auto Grouping Tags
- ② Name: The name of the currently clicked
serviceorpath, corresponding to the object viewed in the lower TAB - ③ Node: Refer to Traffic Topology for details
- ④ Path: Refer to Traffic Topology for details
#1.1.2 Knowledge Graph
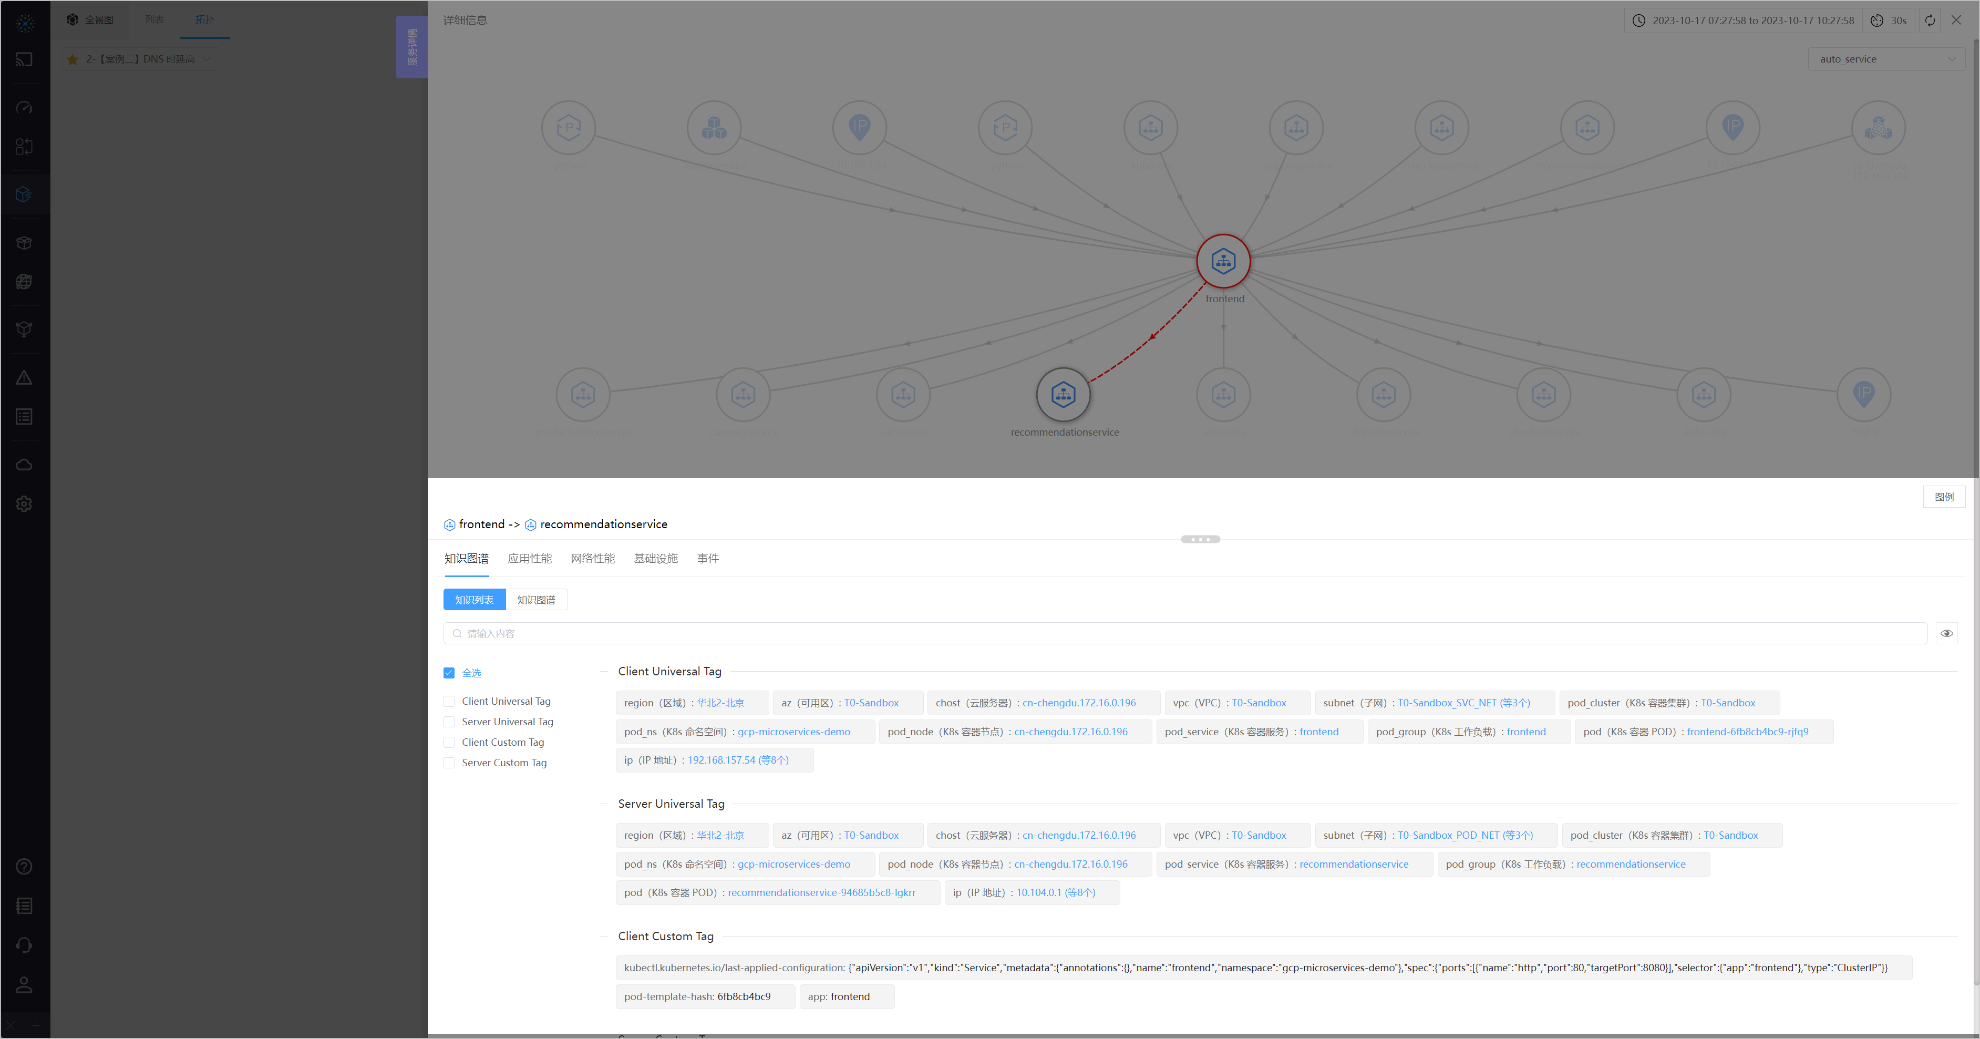
03-Knowledge Graph
Refer to Application - Right Sliding Panel - Knowledge Graph for details
#1.1.3 Application Performance
Use Application Performance to analyze whether there are application-layer anomalies in the selected service or path.
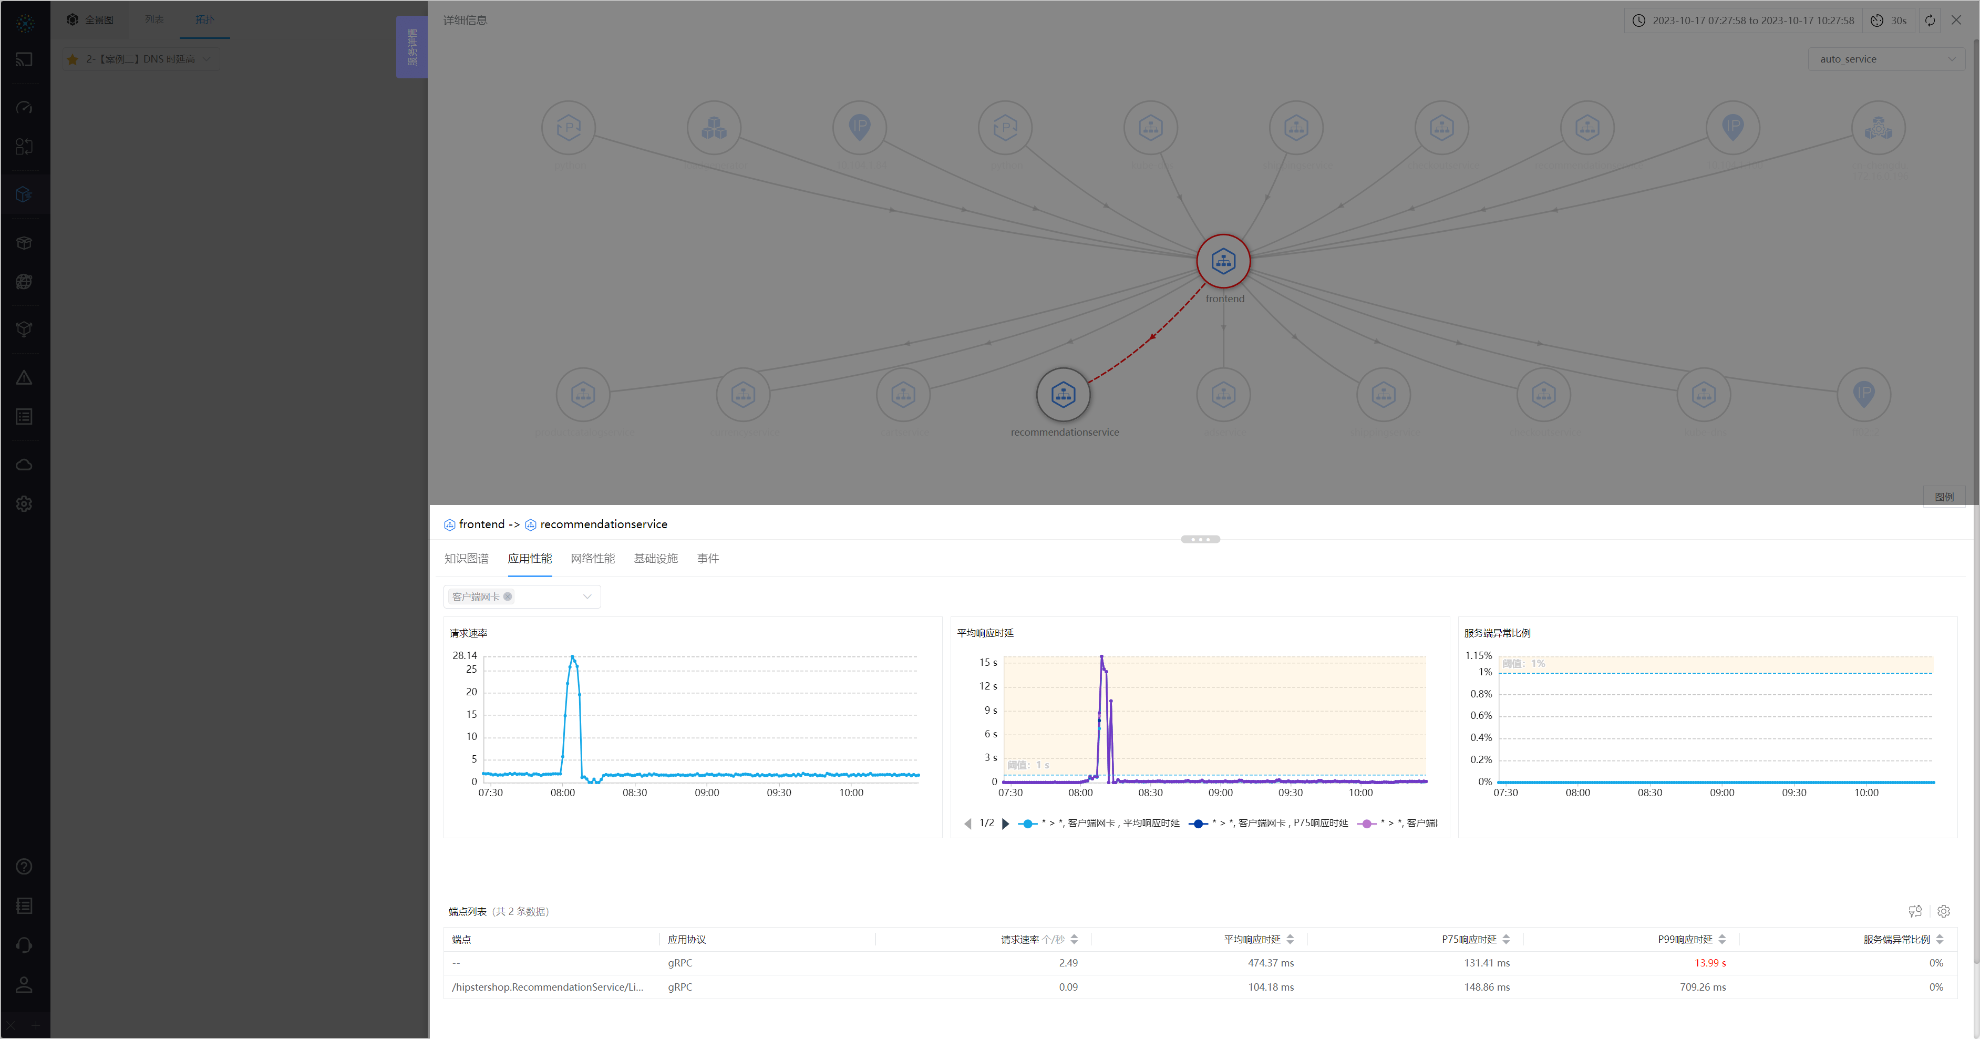
04-Application Performance
The TAB consists of three charts for throughput, latency, and exceptions, along with an endpoint list below. Click a row in the endpoint list to enter the next-level right sliding panel.
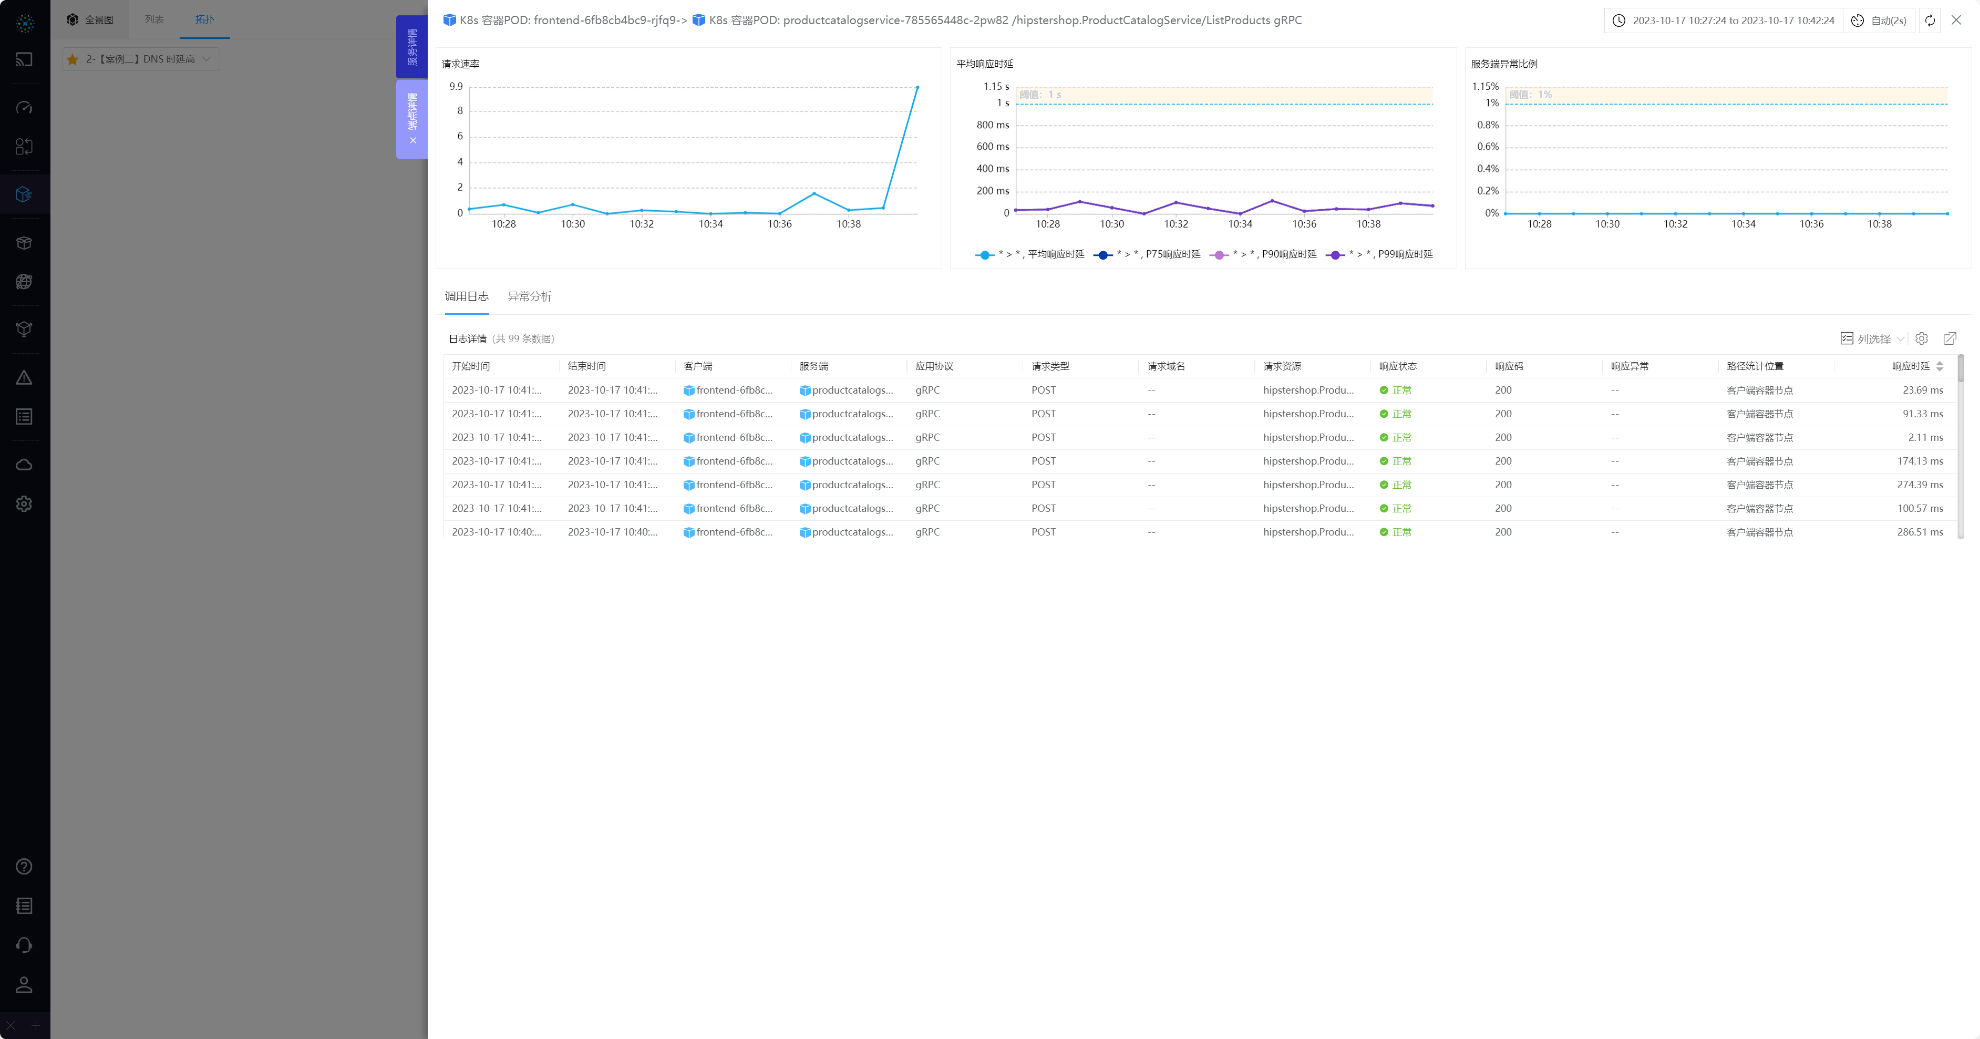
04-1-Application Performance

04-2-Application Performance
The next-level right sliding panel allows viewing the RED metrics and log details of a specific endpoint. If anomalies exist, Exception Analysis can be viewed.
#1.1.4 Network Performance
Use Network Performance to analyze whether there are application-layer anomalies in the selected service or path.
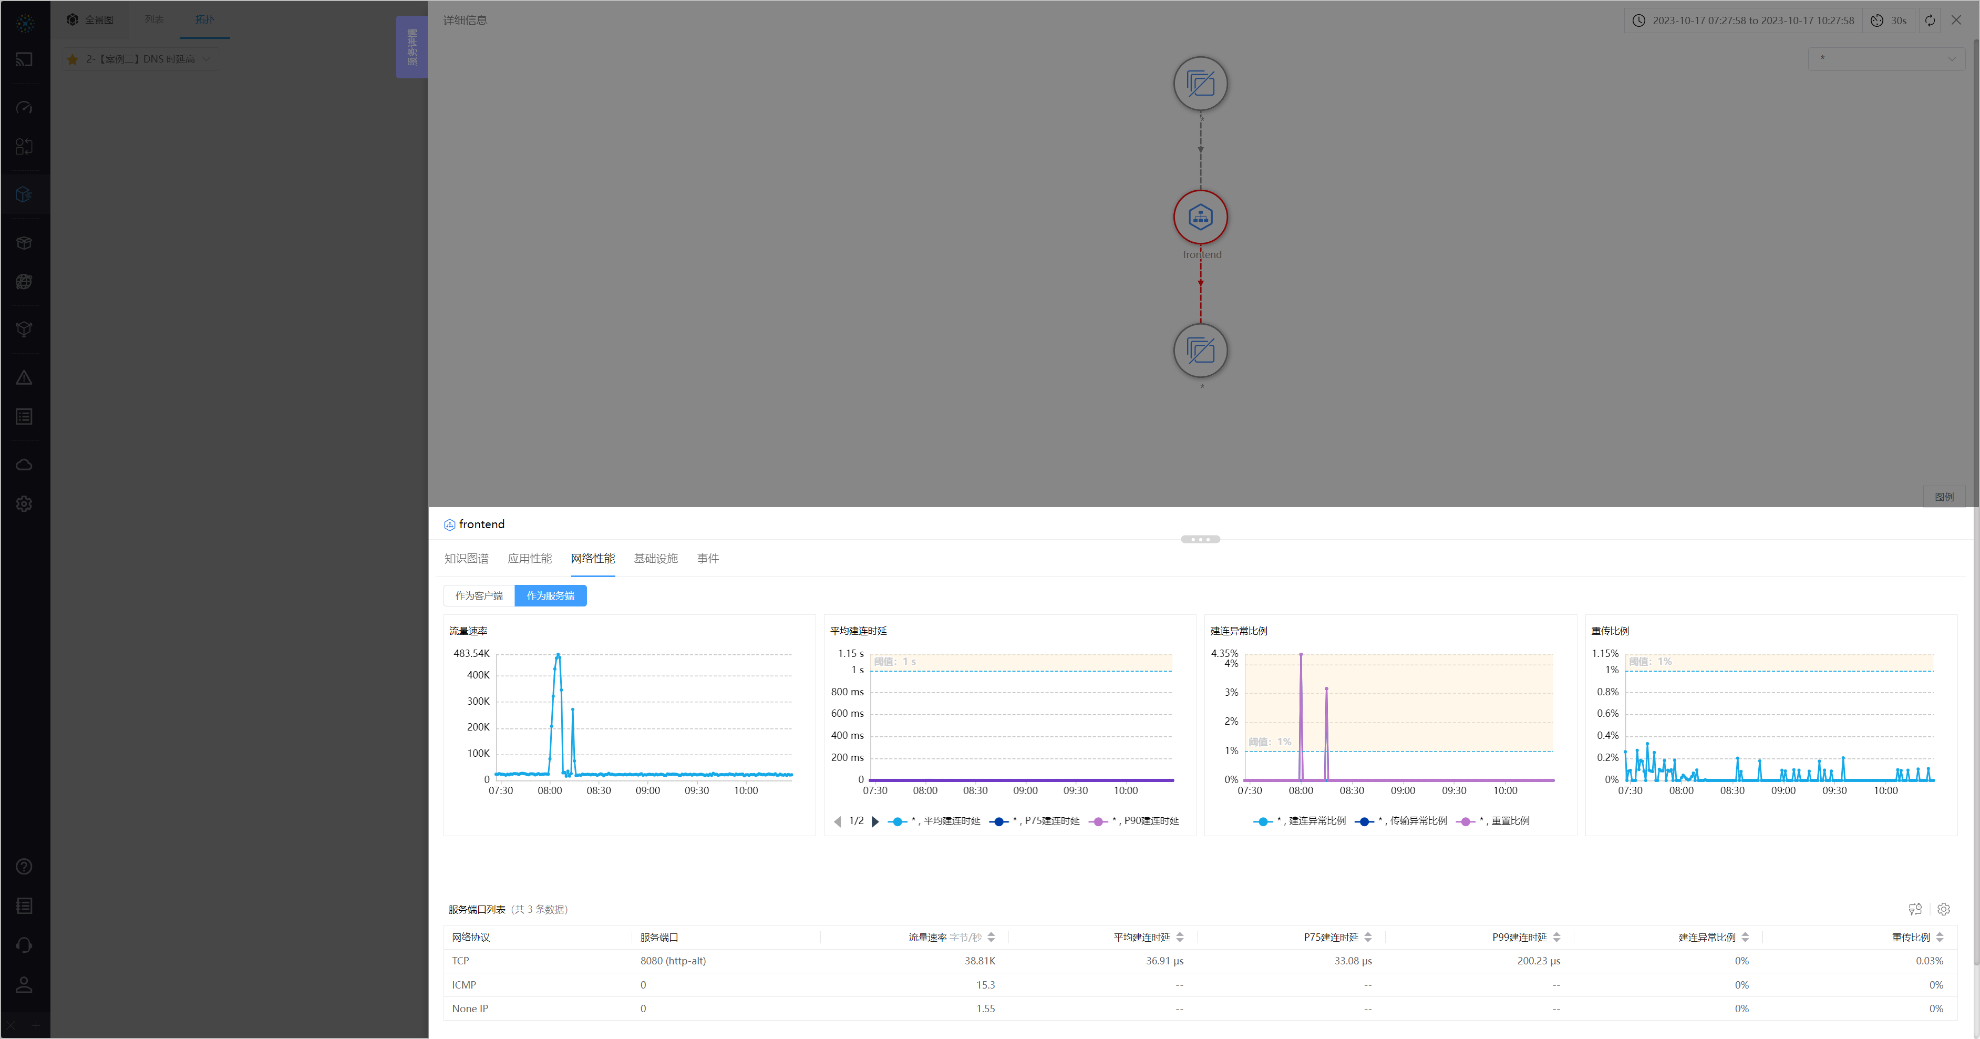
05-Network Performance
The TAB consists of four charts for throughput, latency, exceptions, and performance, along with a service port list below. Click a row in the list to enter the next-level right sliding panel.
- Service: View data for the service
as a clientoras a serverseparately - Path: Click each
observation pointinTopology Analysisto view data for eachobservation pointseparately
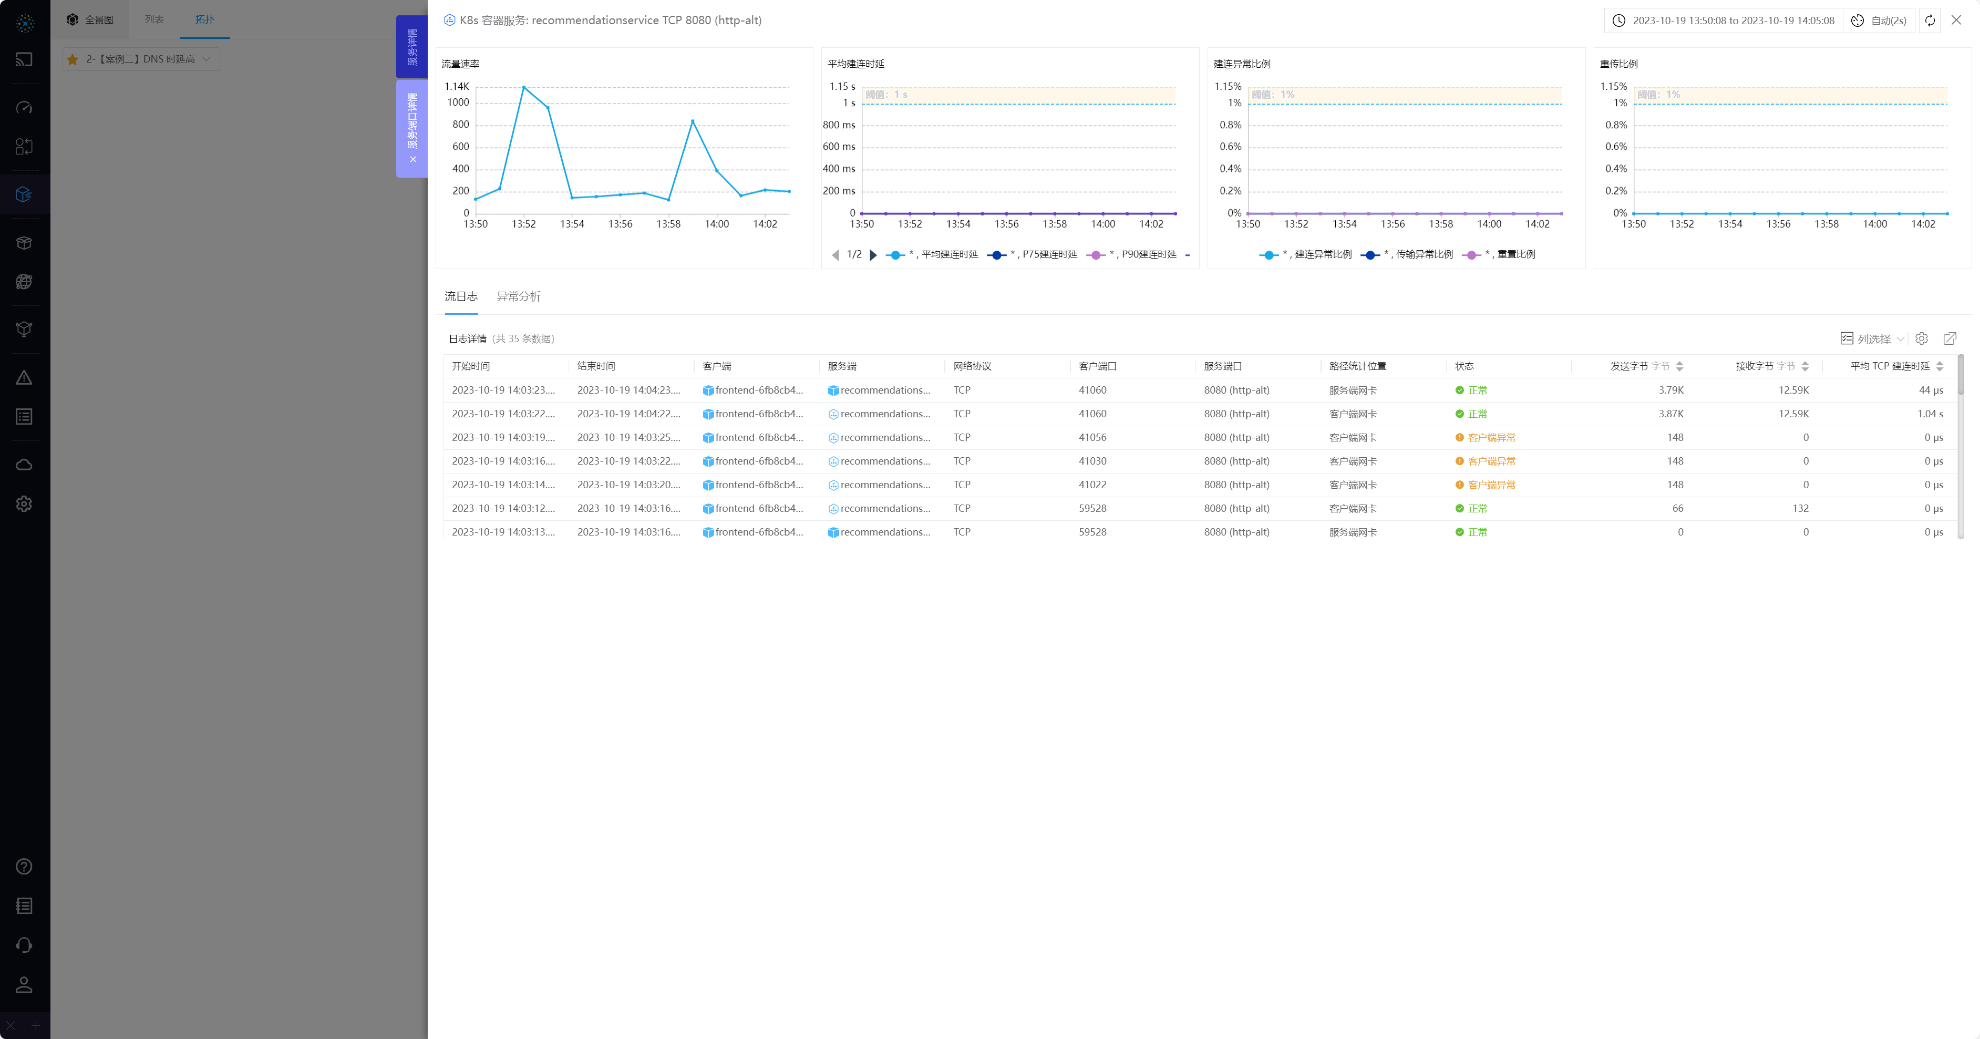
05-1-Network Performance

05-2-Network Performance
The next-level right sliding panel allows viewing the RED metrics and log details of a specific service port. If anomalies exist, Exception Analysis can be viewed.
#1.1.5 Infrastructure
Use Infrastructure to analyze CPU, memory, status, and other data of the infrastructure instances corresponding to the service.

06-Infrastructure
① Switch Service: Switch the service whose infrastructure you want to view. The options are the two services at both ends of the clicked path or the clicked service itself.
#1.1.6 Events
View resource change events for a service or path.
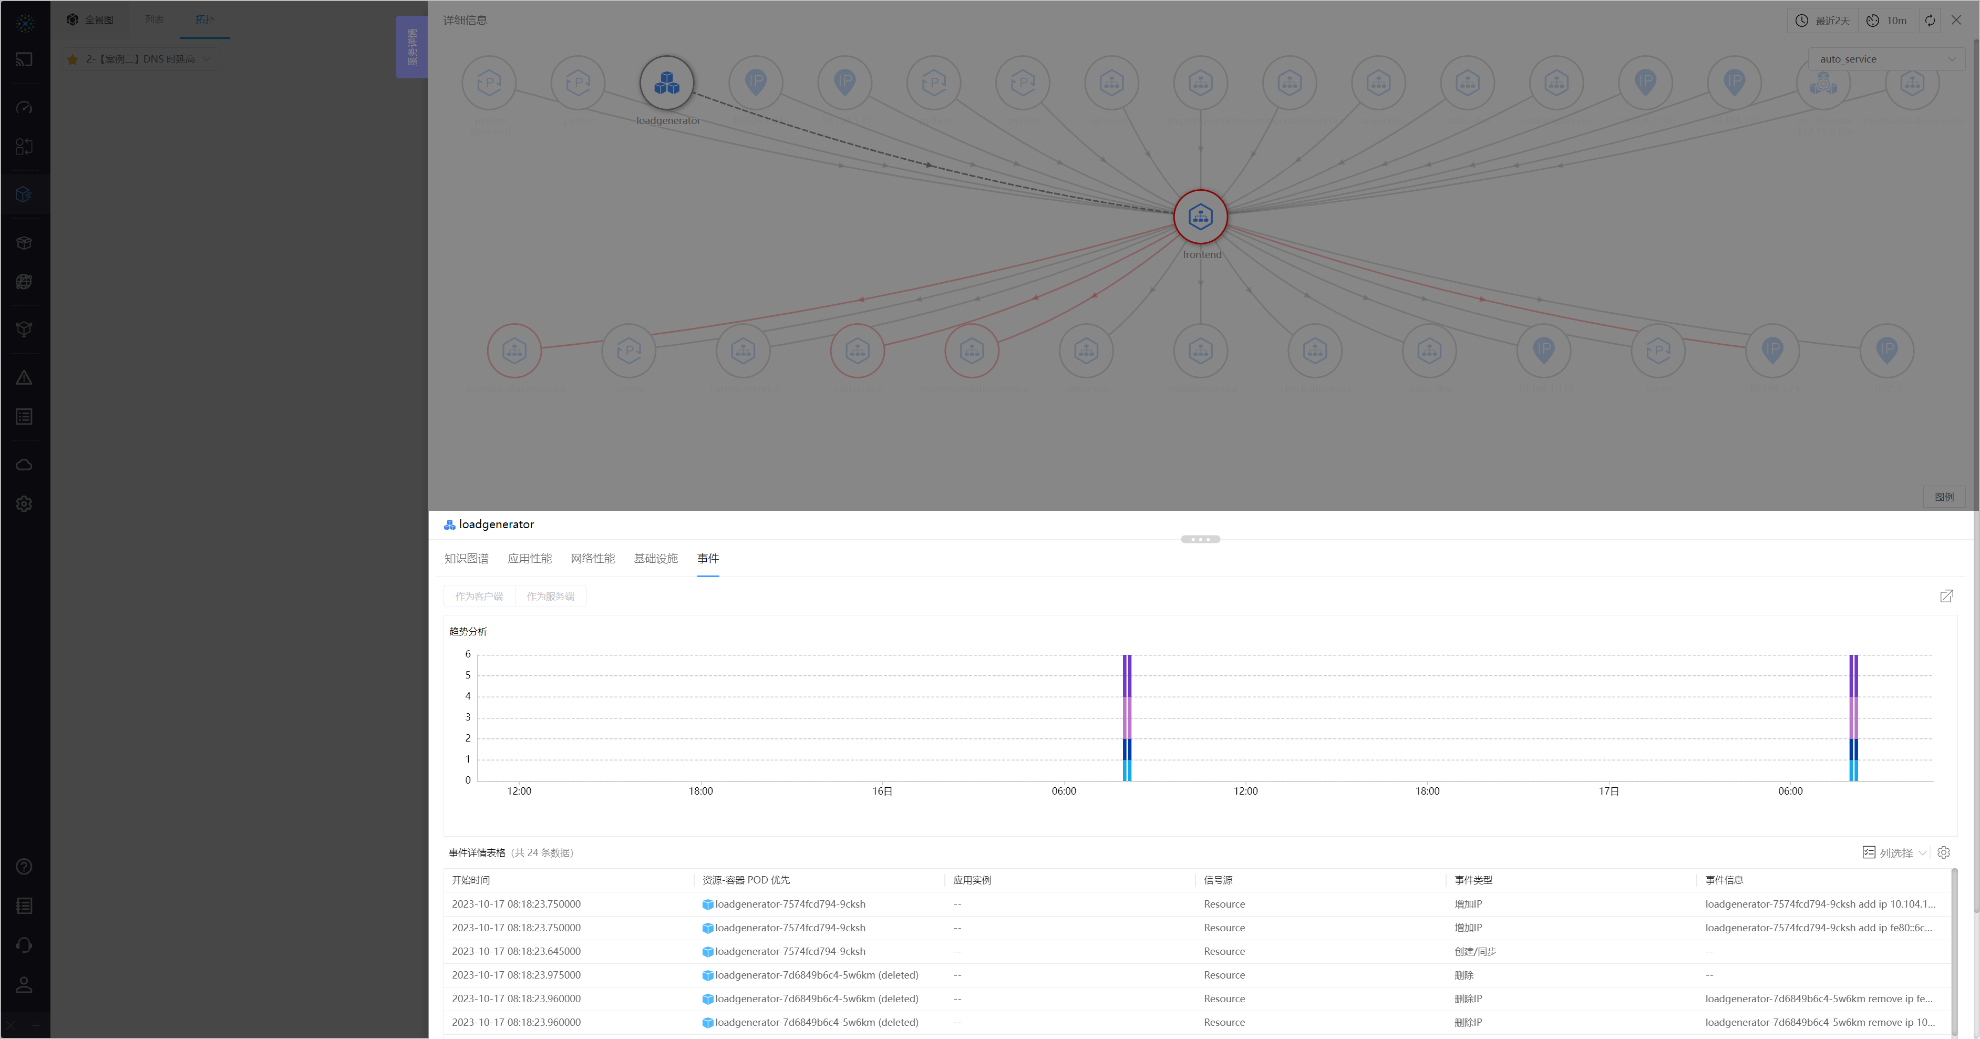
06-Events
Refer to Tracing - Right Sliding Panel - Events for details