


 Right Sliding Panel
This document was translated by ChatGPT
#1. Right Sliding Panel
Clicking on a table row, line chart legend, topology diagram, or similar elements on a functional page will bring up the right sliding panel, which displays detailed information about the clicked data. The right sliding panel offers multiple features, including Knowledge Graph, Traffic Relationship, Application Metrics, Endpoint List, Call Logs, Distributed Tracing, Network Metrics, Network Path, Flow Logs, NAT Tracing, Events, and more, to meet different user needs. You can select the corresponding feature based on actual requirements to view and analyze data, enabling faster problem detection and resolution, and improving work efficiency.
The following sections provide detailed instructions for each feature.
#1.1 Knowledge Graph
The Knowledge Graph displays all Tags associated with the clicked data object in both list and topology formats.

Knowledge Graph
- Knowledge List: Displays all Tags associated with the clicked data object in key-value pairs, categorized into
Universal Tag (resource tags),Custom Tag, andothers.- Note: If the clicked data is from the
Call Series Page, categories will be distinguished between Client and Server. - Operations: Supports searching, category filtering, and empty value filtering for key-value pairs.
- Search: Supports quick search across data in
Select All. - Left-side category filter: Check the categories to display for quick content filtering.
- Show/Hide empty tags: Show or hide tags with a value of
--. - Hover over a tag and click the
copyicon to quickly copy it.- Paste the copied content into the search bar, which can be converted into a search tag. For details on using search tags, refer to the Service Search Box section.
- Search: Supports quick search across data in
- Note: If the clicked data is from the
- Knowledge Graph: Displays the relationships between Tags in a star topology. Clicking a node shows its associated nodes.
#1.2 Traffic Relationship
The upper section displays upstream and downstream metrics of the clicked data object in a table. Clicking a row uses DeepFlow’s proprietary flow tracing algorithm to trace the access data through observation points in the virtual or physical network.

Traffic Relationship
- ① Dropdown: Click to select the object whose traffic relationship you want to view. If the clicked data is from the
Path Data Page, there will be two objects. - ② Role: Check
As ClientorAs Serverto view metrics when the current object acts as aClientorServer.

Virtual - Link Topology
The link topology is sorted from left to right according to the observation points the access data passes through, e.g., Client Application -> Client Process -> Client NIC -> ... -> Server NIC -> Server Process -> Server Application.
- Note: Each
nodein the topology represents aggregated information from the same observation point. - Hover: View metric information.

Virtual - Detail Table
The detail table shows detailed information for each observation point of the access data, including the resource it belongs to, data collection location, tunnel information, and metric details.
- Clicking a row will open the detailed information of the clicked observation point in the right sliding panel.

Virtual - Bar Chart
The bar chart displays the same data as the link topology but in a bar format for easier visual comparison.
- ① Latency Difference: For example, the chart above shows the response latency metrics of access data at each observation point. The differences between bars clearly indicate a significant latency bottleneck from the
Client Container Nodeto theServer Container Nodecompared to other points.

Physical Topology
When access data passes through the physical network, it is displayed in a physical topology showing the metric values collected at each physical collection point.
Nodedata is obtained from the correspondingnetwork location. If no data is collected at a location for the currentaccess data, it will be shown as empty.
#1.3 Application Metrics
Application metrics display aggregated values of application metrics over a period in an overview chart. Multiple line charts can be added to show metric trends over time.

Application Metrics
- Metric Curve
- Metric Name: Click to select the metric line chart to display.
- Aggregation Function: Supports applying functions to the selected metric.
- Grouping: Supports grouping the current data. For example, when viewing the response latency of a service, you can further group by
l7_protocolto see latency per application protocol. - Enable/Disable Tip Sync: When enabled, view metric values at the same time point across all line charts.
- Click the time component in the upper right to filter data by time.
#1.4 Endpoint List
The endpoint list displays metrics grouped by endpoint.
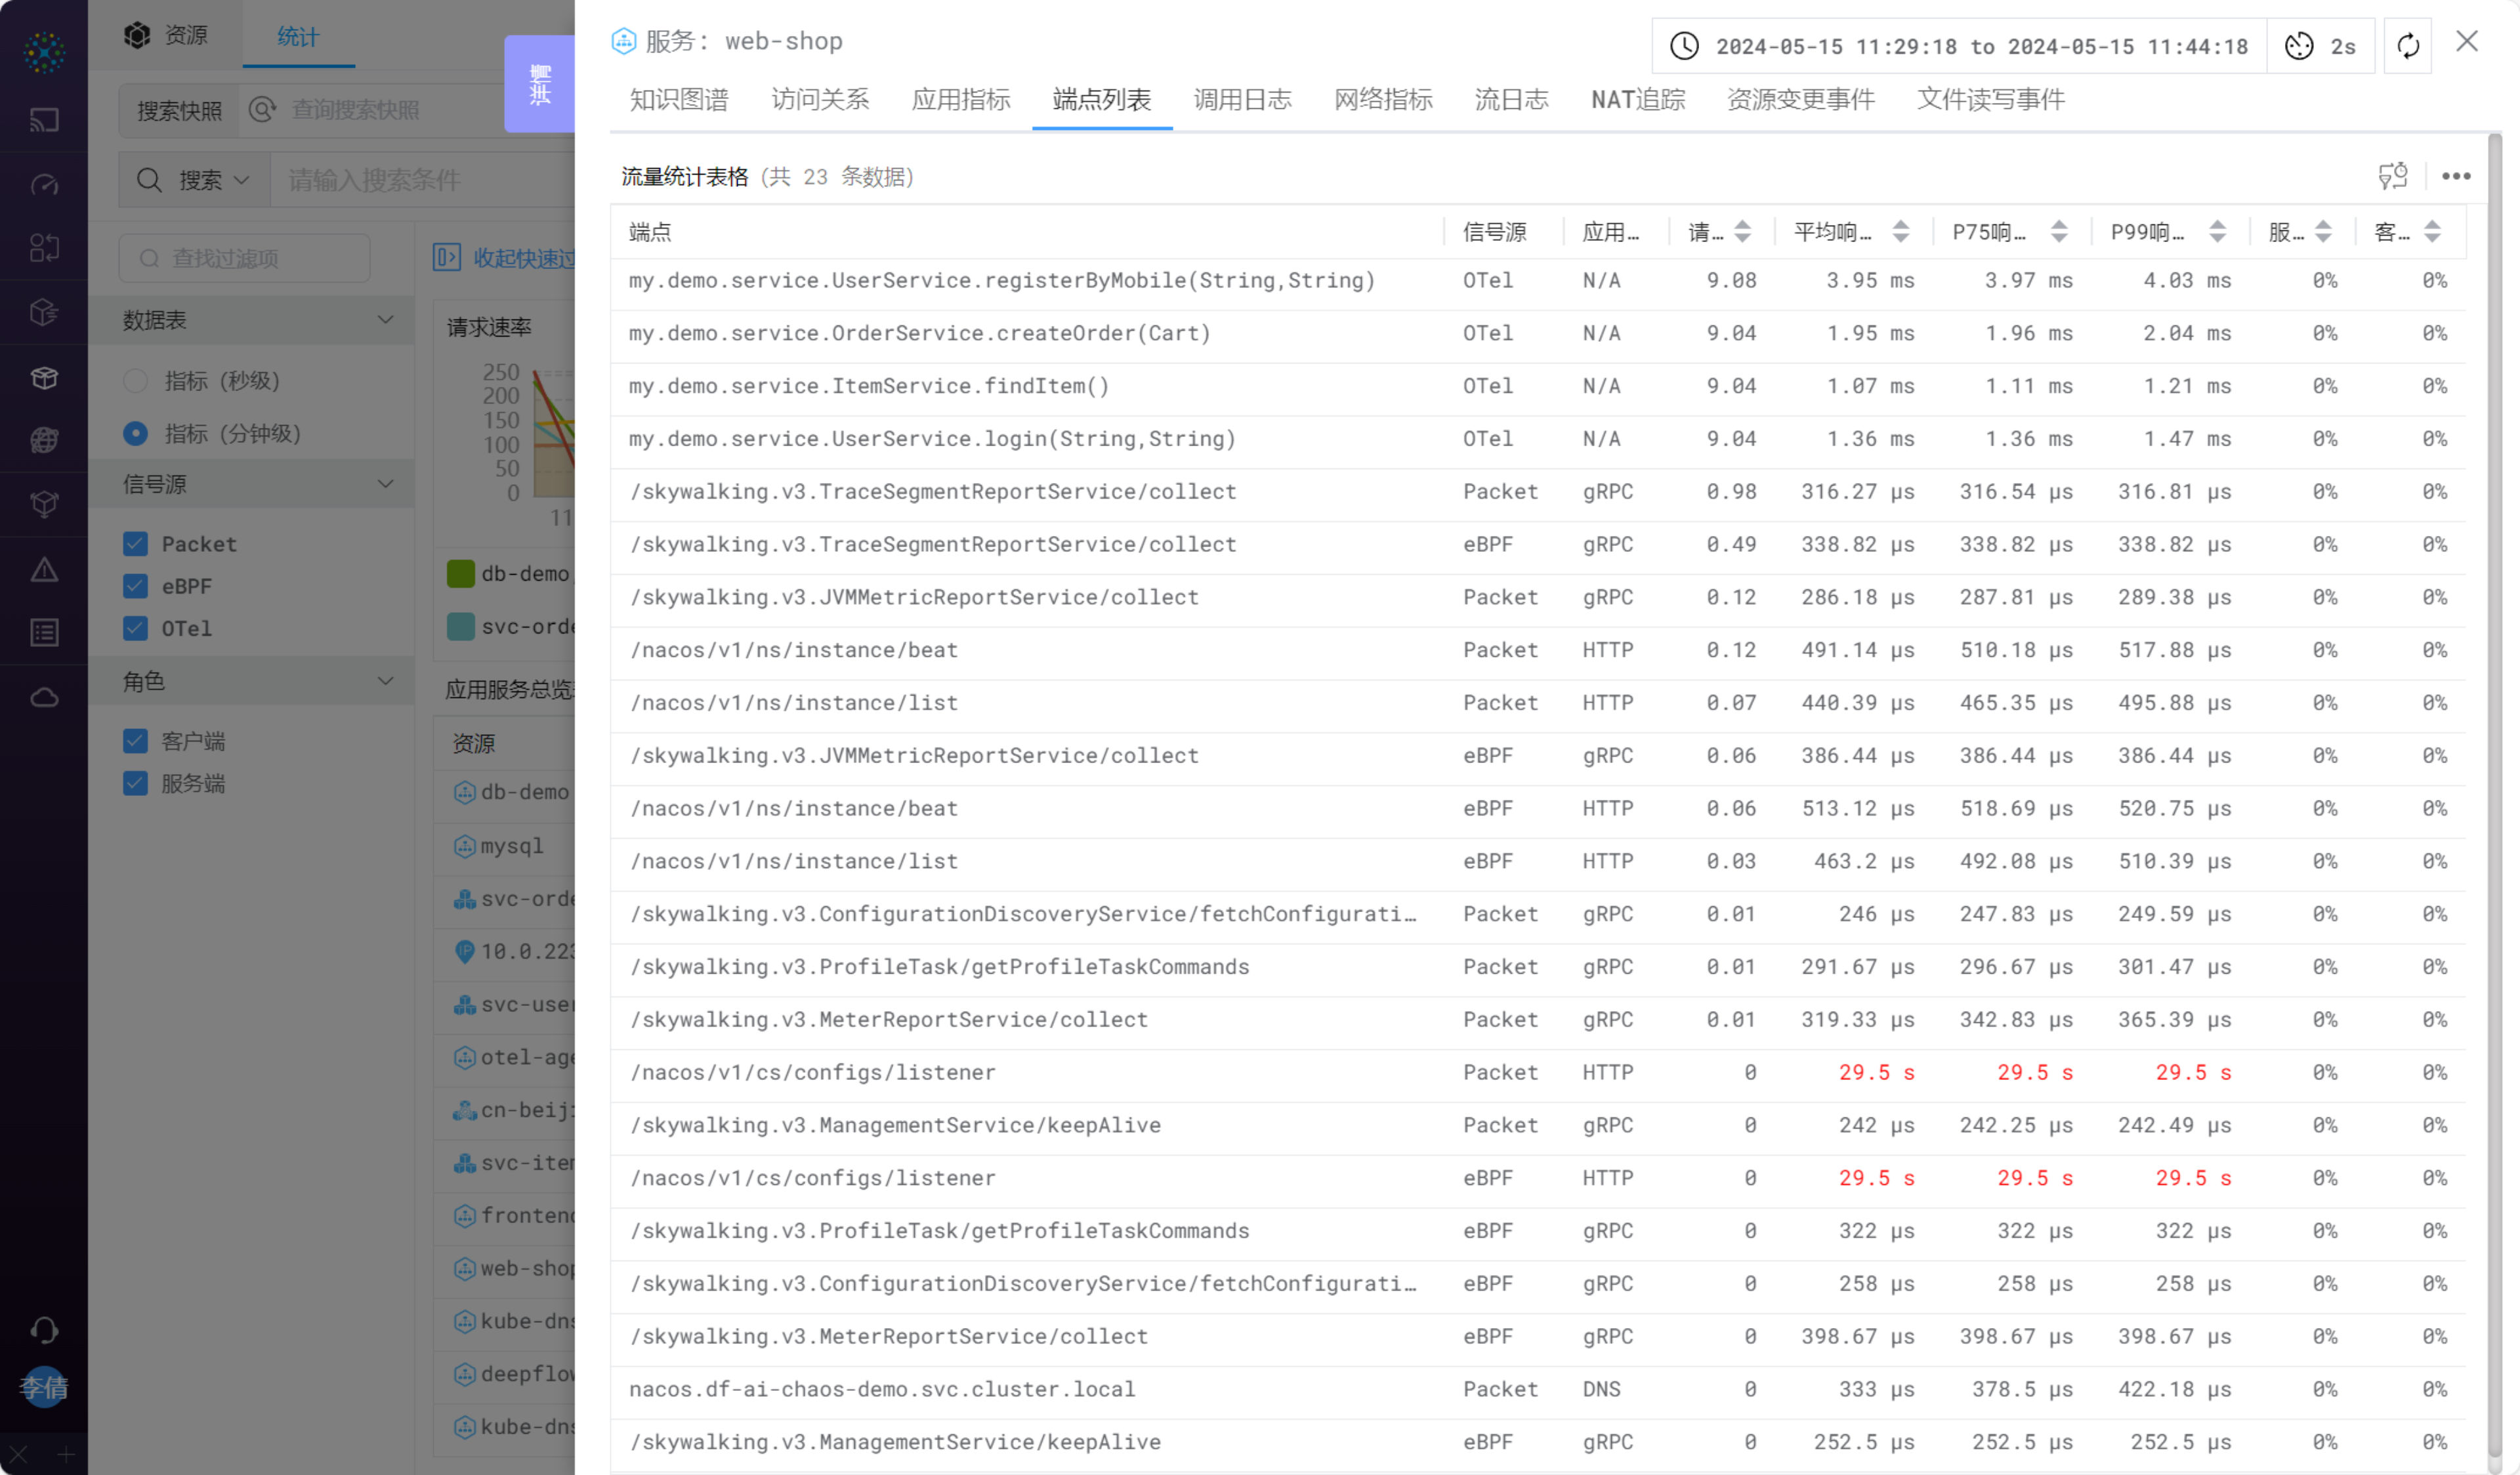
Endpoint List
- Click a table row to enter the
Call Logspage for thatendpoint. For details, see the Call Logs section. - Click the time component in the upper right to filter data by time.
#1.5 Call Logs
Call logs display detailed call log data for the clicked item in both trend analysis chart and table formats.

Call Logs
- Trend Analysis Chart: Shows log collection over a time range. Users can select any time segment to zoom in and view logs for that period.
- Log Detail Table: Displays log information such as client, server, application protocol, request type, request domain, etc., and dynamically updates based on the trend chart. For details, see Table.
- Click a table row to enter the log detail page. For details, see Call Log Details.
- Click the icon in the upper right of the trend chart to open the
Call Logspage in a new tab for custom searches. - Click the time component in the upper right to filter data by time.
#1.6 Call Log Details
The call log details page shows response latency, application protocol, request type, request resource, and response status between the client and server at the top. Below the basic information are two buttons with different actions depending on the log source. Below the buttons are the Tags and Metrics for the log, displayed as key-value pairs for quick reference.
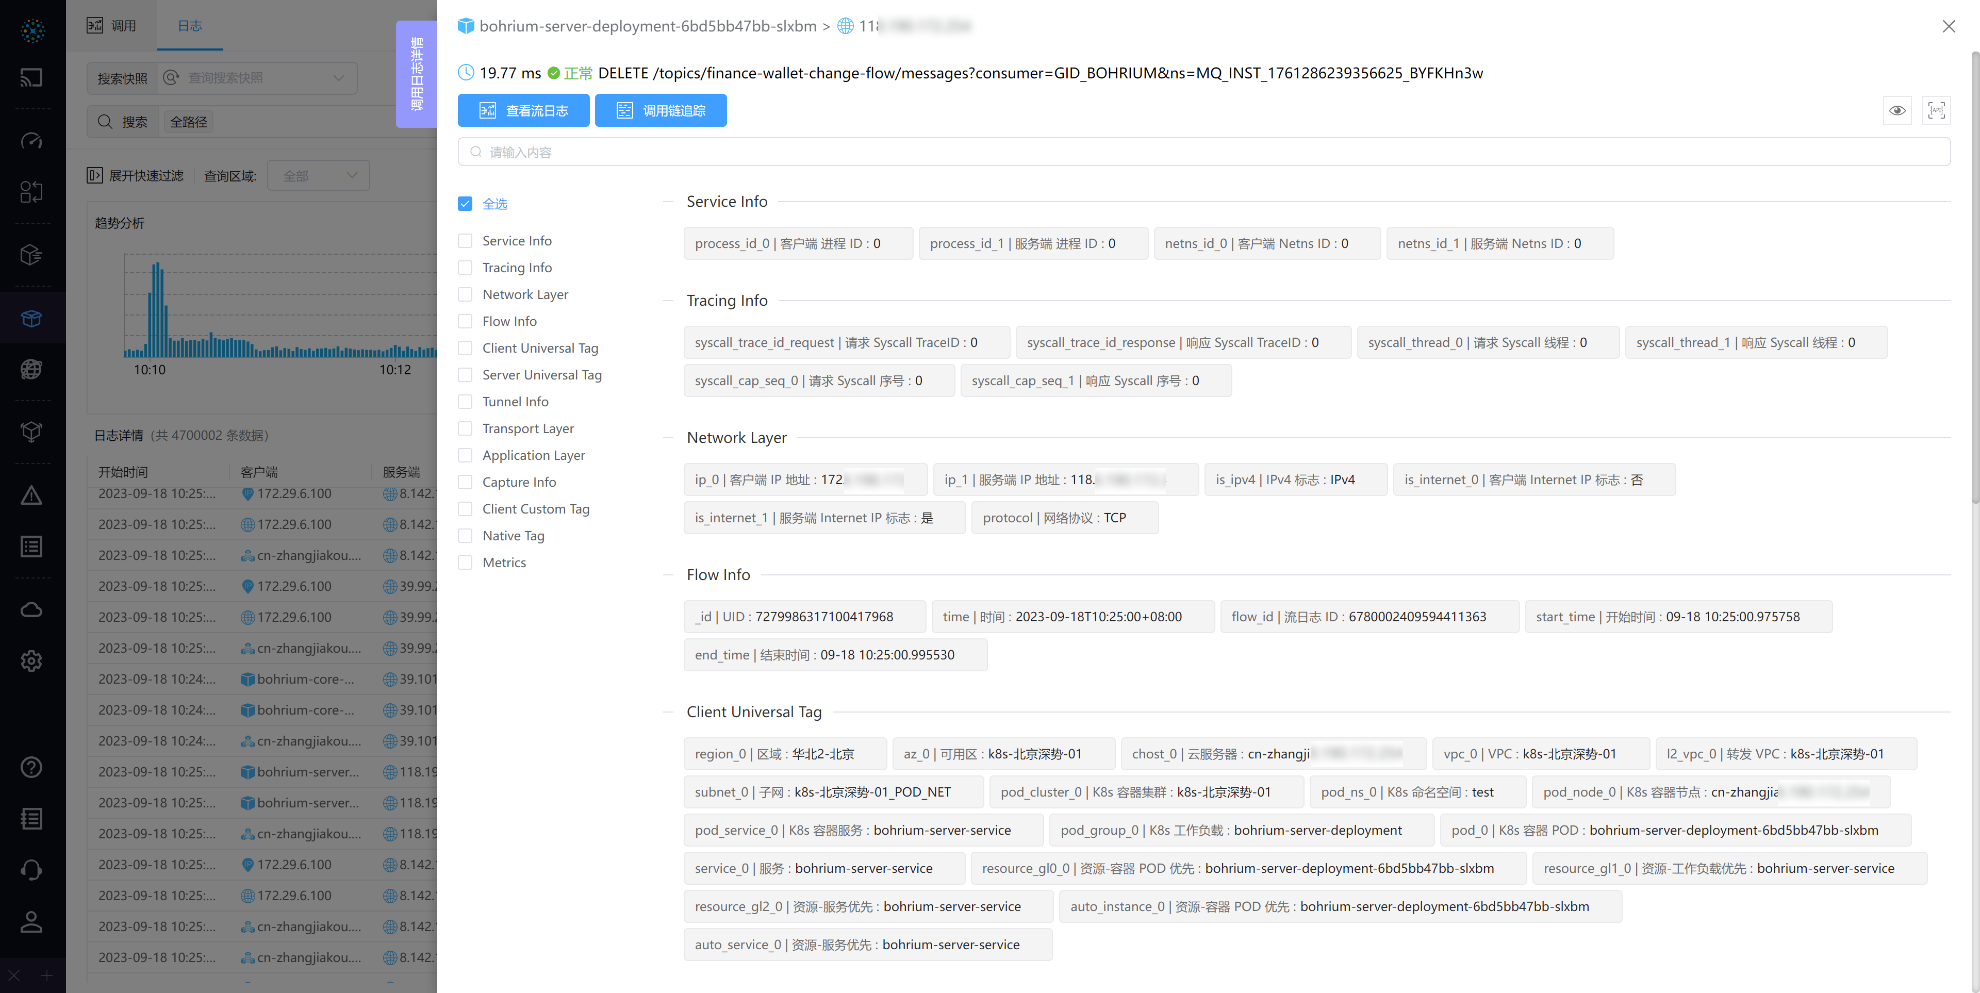
Call Log Details
- Action Buttons:
- View Flow Logs: Available only for logs with
Packetas the signal source. For details, see Flow Log Details. - Distributed Tracing: Available for logs with
eBPForOTelas the signal source. For details, see Distributed Tracing.
- View Flow Logs: Available only for logs with
- For tag search, filtering, and other
operations, see Knowledge Graph.
#1.7 Network Metrics
Network metrics display aggregated values over a period and show trends in a line chart.

Network Metrics
- Metric Name: Click to select the metric line chart to display.
- Aggregation Function: Supports applying functions to the selected metric.
- Grouping: Supports grouping the current data. For example, when viewing the traffic size of a cloud server, you can further group by
server_portto see traffic per port. - Enable/Disable Tip Sync: When enabled, view metric values at the same time point.
- For details on using line charts, see Line Chart.
- Click the time component in the upper right to filter data by time.
#1.8 Flow Logs
Flow logs record detailed information for each flow at a one-minute granularity, displayed in both trend analysis chart and table formats.

Flow Logs
- Trend Analysis Chart: Shows flow log collection over a time range. Users can select any time segment to zoom in and view logs for that period.
- Log Detail Table: Displays flow log information such as client, server, application protocol, request type, request domain, etc., and dynamically updates based on the trend chart. For details, see Table.
- Left Quick Filter: Filter flow logs using the left sidebar. For details, see Left Quick Filter.
- Click a table row to enter the log detail page. For details, see Flow Log Details.
- Click the icon in the upper right of the trend chart to open the
Flow Logspage in a new tab. - Click the time component in the upper right to filter data by time.
#1.9 Flow Log Details
Flow log details provide further information. For TCP protocol logs, TCP sequence diagram tracing and NAT tracing are available.

Flow Log Details
- Action Buttons:
- TCP Sequence Diagram: Displays detailed information for each TCP packet header, showing the process of connection establishment, data transfer, and connection closure. For details, see TCP Sequence Diagram Analysis.
- NAT Tracing: Initiates tracing using a
five-tuple. For details, see NAT Tracing Details. - PCAP Download: If a matching PCAP policy exists, download is available.
- Call Logs: Displays current call log information (see below 14 - Call Logs).
- For
operations, see Knowledge Graph.

Call Logs
- Consists of a call trend analysis chart and call log table.
- Trend Analysis Chart: Shows the number of requests over a time range.
- Call Log Table: Displays detailed call log information. Click a row to enter the
Call Log Detailspage.
#1.10 TCP Sequence Diagram
The TCP sequence diagram displays detailed information for each TCP packet header in both trend analysis chart and table formats, including timestamps, direction, flags, Seq, Ack, etc., during connection establishment, data transfer, and connection closure, for deeper network communication analysis and troubleshooting.

17-TCP Sequence Diagram
- Click the time component in the upper right to filter data by time.
- Sequence Table:
- Time, Seq, and Ack can be toggled between relative and absolute values via the list header buttons.
- Interval time is the difference between the current and previous row.
- PCAP Download: If the current flow matches a PCAP policy, the PCAP file can be downloaded.
#1.11 NAT Tracing
NAT tracing can initiate tracing for any TCP four-tuple or five-tuple, using DeepFlow’s proprietary algorithm to automatically trace traffic before and after NAT. The NAT tracing page displays metrics for the four-tuple in a table. Clicking Trace initiates tracing.

NAT Tracing
- Click a table row to trace the data. For details, see NAT Tracing Details.
- Click the icon in the upper right to open the
NAT Tracingpage in a new tab for custom searches. - Click the time component in the upper right to filter data by time.
#1.12 NAT Tracing Details
NAT tracing details are divided into three parts: the header with information about the traced flow, the left side showing the traced network topology (virtual and physical), and the right side showing the corresponding traffic topology.
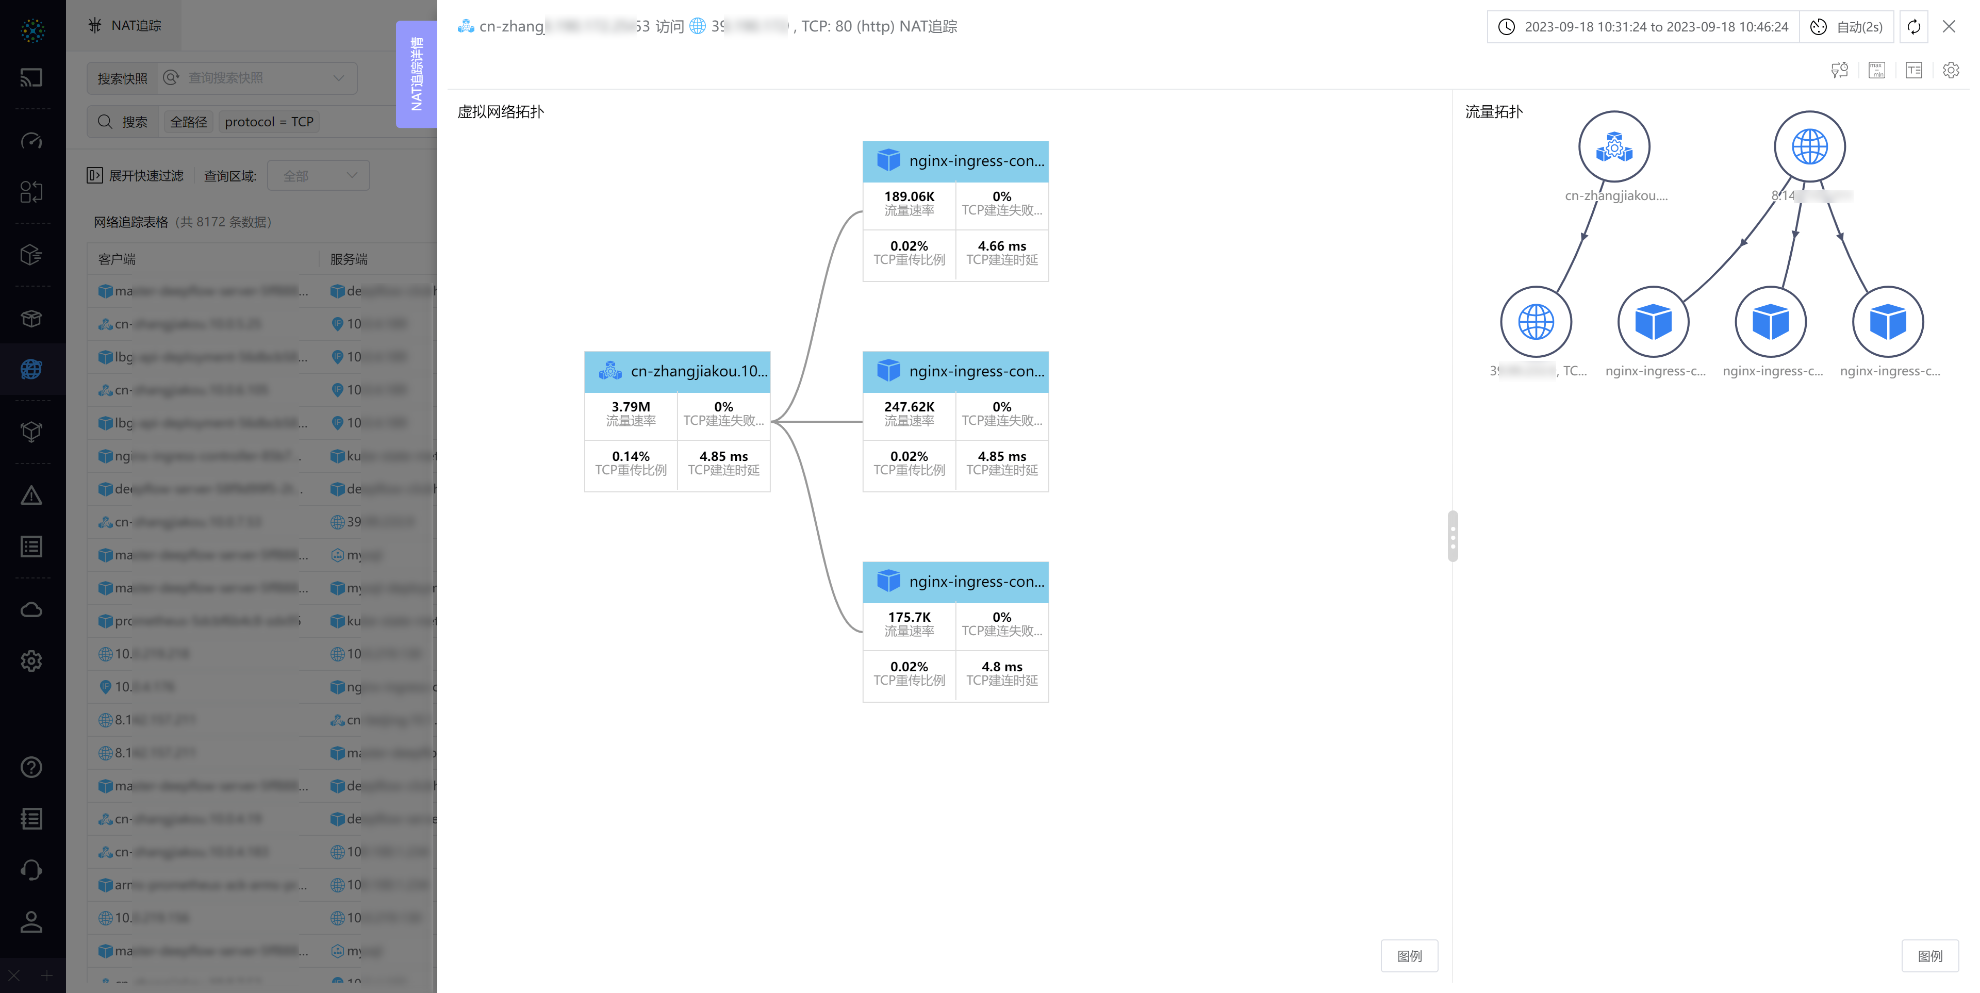
NAT Tracing Details
- Traffic Topology: Displays all traced traffic in a
free topology. Click alineto view detailed path information. - Network Topology: Displays observation points of the traced traffic in a
waterfall topology.- Virtual Network Topology: Shows observation points in the virtual network, such as client NIC, client container node, server container node, server NIC.
- Physical Network Topology: Shows network locations in the physical network.
- Note: Only displayed if the traced traffic passes through the physical network.
- Operations:
- Hover over
nodesandlinesto view detailed information, including observation point, network location, tunnel info, and metrics.
- Hover over
- Action Buttons:
- Change Metrics: Switch the queried metrics.
- Show/Hide Delta: Show or hide the difference in primary metrics between adjacent nodes in the
network topology. - Show/Hide Full Names: Show or hide full node names in the topology.
- Settings:
- Add to Dashboard: Add the Panel to a Dashboard.
- View API: Basic Panel operation. See Traffic Topology - Settings.
- Toggle Thumbnail: Show/hide the thumbnail in the lower left of the topology.
- Matching Algorithm Degree: Adjust NAT tracing algorithm parameters.
- Click the time component in the upper left to filter data by time.
#1.13 Resource Change Events
Displays resource change events for the clicked data object in both trend analysis chart and table formats.

Resource Change Events
#1.14 File Read/Write Events
Displays file read/write events for the clicked data object in both trend analysis chart and table formats.
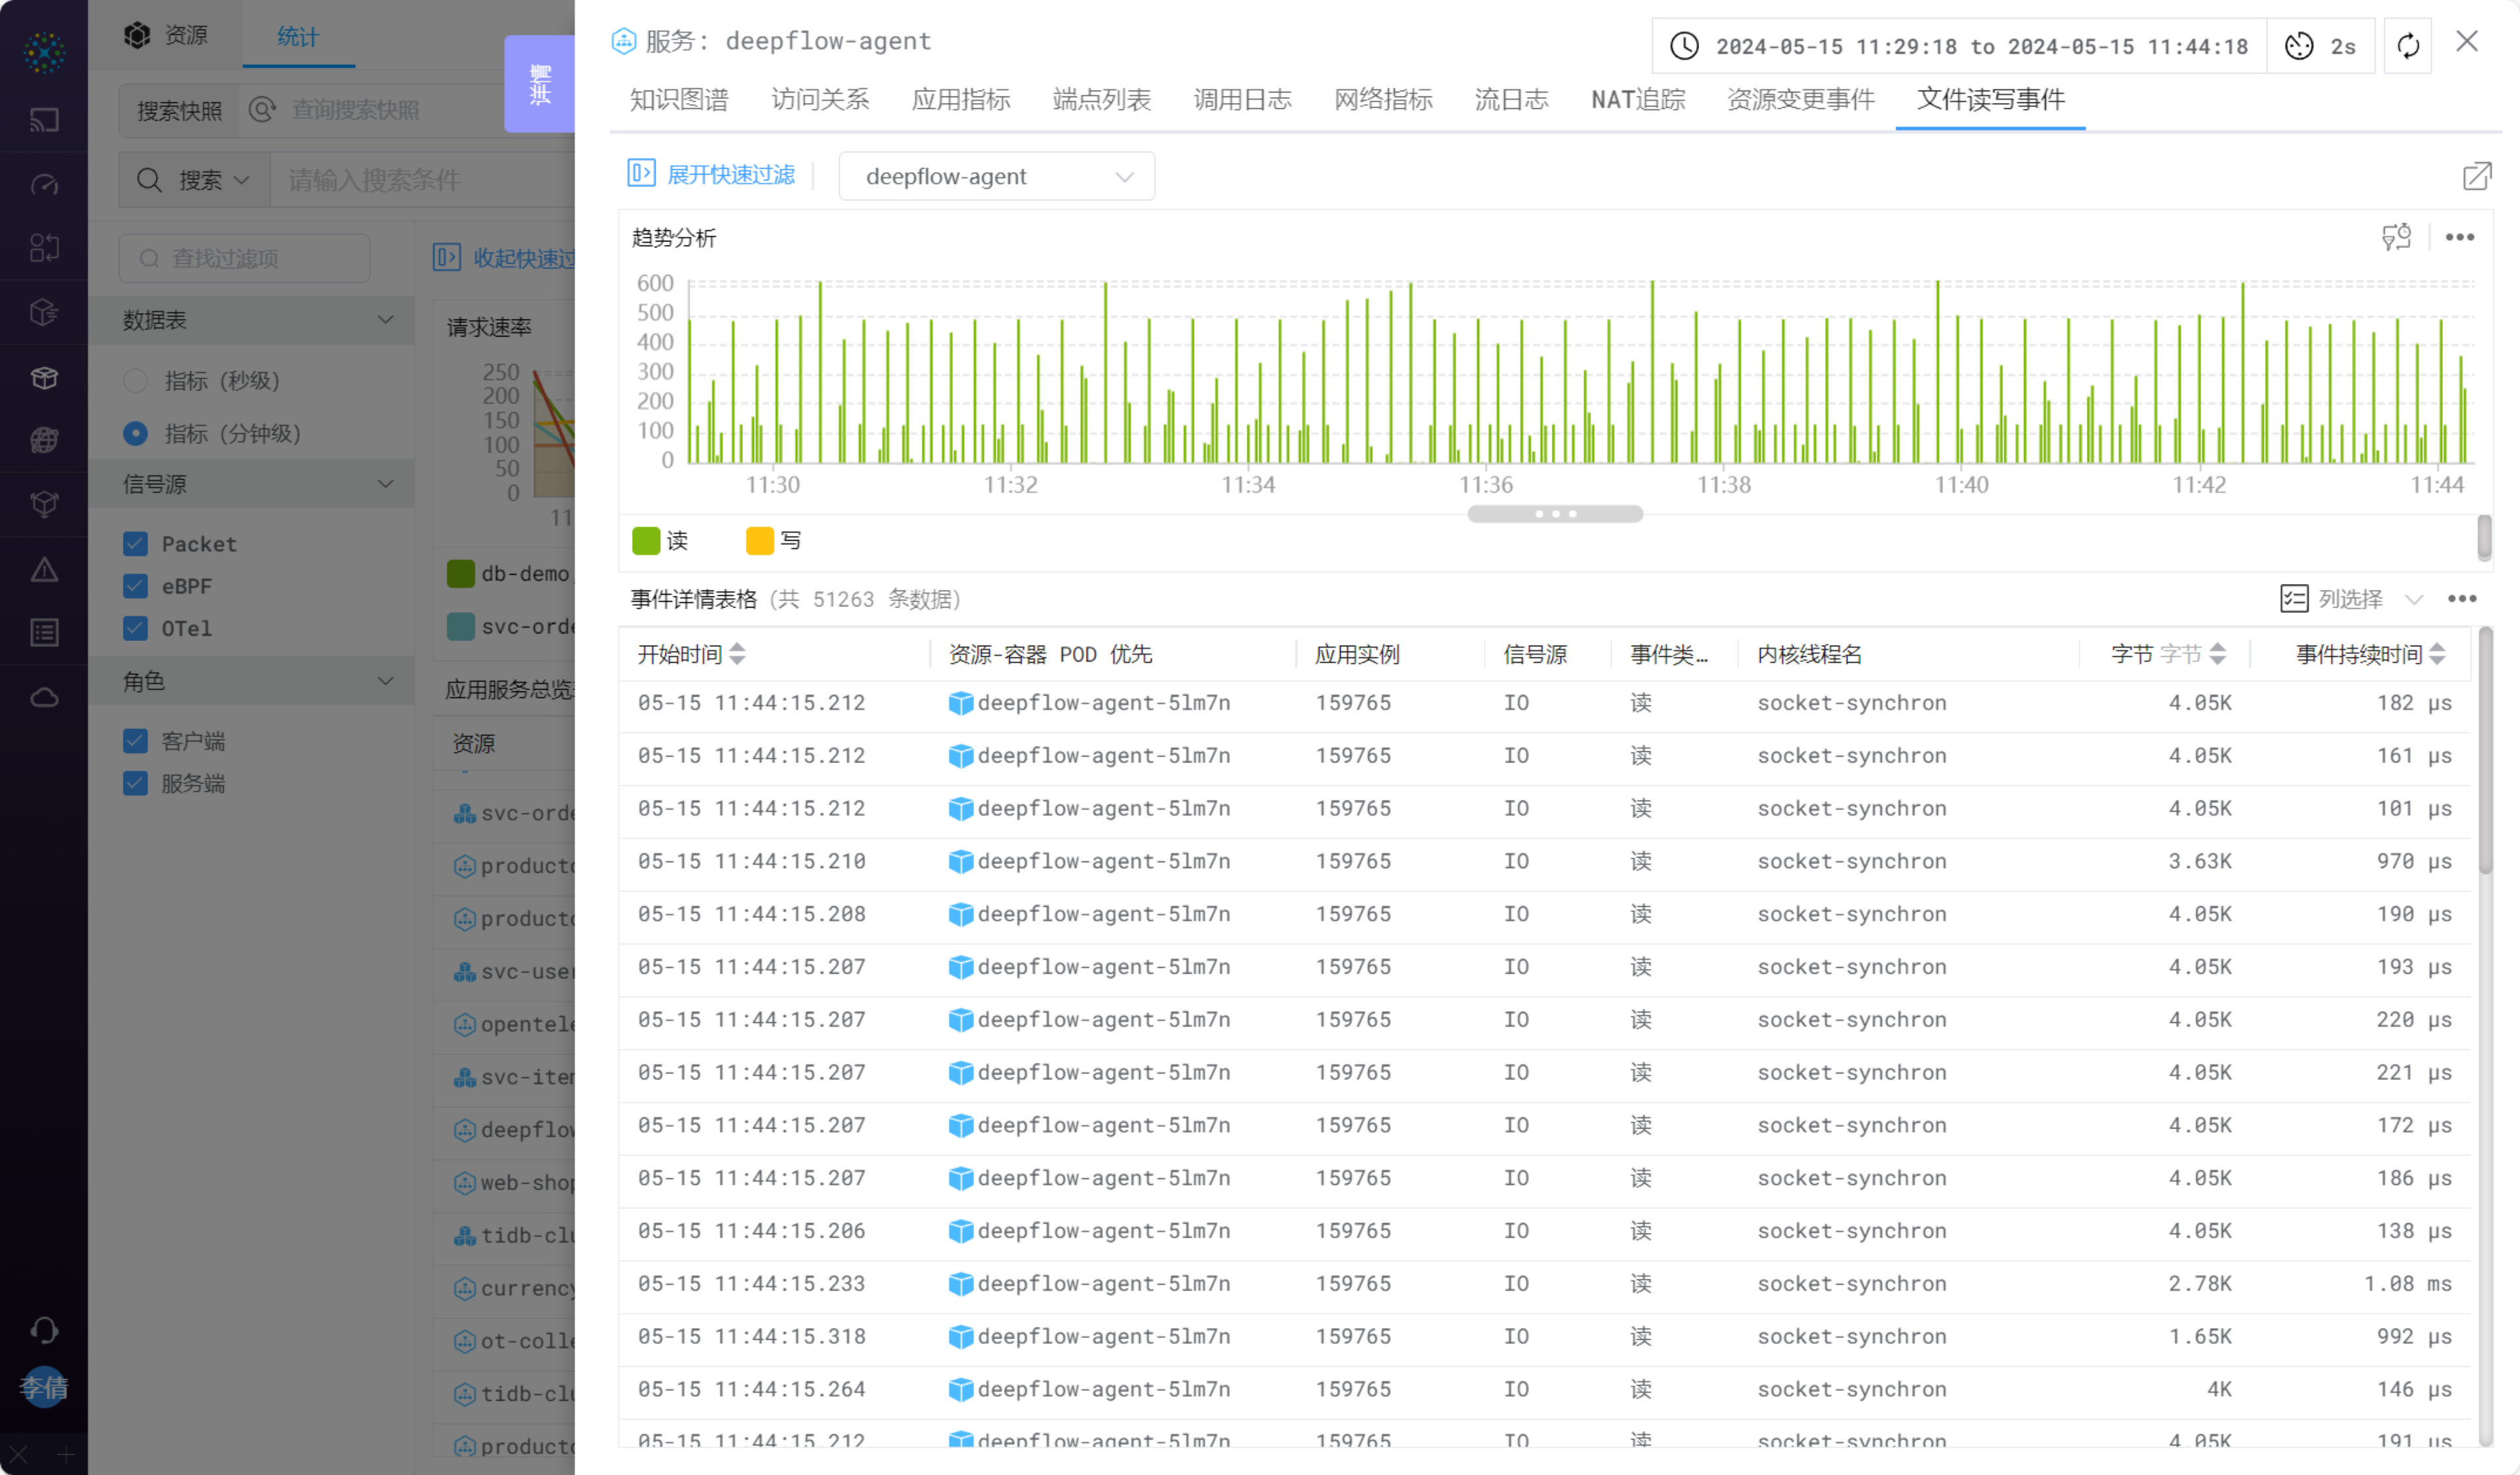
File Read/Write Events