


 Server Performance Tuning
This document was translated by ChatGPT
#1. Investigating Packet Loss Causes in deepflow-server
Influencing factors:
Server performance bottleneck
- Check CPU and memory bottlenecks via the DeepFlow Server Dashboard. If they are fully utilized, it indicates a non-server bottleneck.
ClickHouse performance bottleneck
Use the following queries to determine ClickHouse write performance:
-- Receiving performance of a single ClickHouse:
-- written_rows / (qurey_duration_ms/1000) * server write thread count (ingester.flow-ck-writer.queue_count)

SELECT event_time,query_duration_ms,written_rows,written_bytes,query
FROM system.query_log
WHERE event_time>now()-1000 AND query LIKE '%INSERT INTO%'
ORDER BY query_duration_ms
DESC limit 10
1
2
3
4
5
6
7
8-- Average data written per second from server to ClickHouse SELECT tag_values[1] AS host, AVG(metrics_float_values[4])/10 AS written_per_s, AVG(metrics_float_values[3])/10 AS drop_per_s FROM deepflow_system.deepflow_system WHERE virtual_table_name='deepflow_server_ingester_ckwriter' GROUP BY host ORDER BY written_per_s DESC limit 30;1
2
3
4
5
6
7
8-- How to check server packet loss queues SELECT tag_values[1] AS host, tag_values[3] AS queue, AVG(metrics_float_values[1])/10 AS avg_total_per_s, AVG(metrics_float_values[2])/10 AS avg_handled_per_s, AVG(metrics_float_values[3])/10 AS avg_drop_per_s FROM deepflow_system.deepflow_system WHERE virtual_table_name='deepflow_server_ingester_queue' AND time > now()-900 GROUP BY host,queue ORDER BY avg_drop_per_s,avg_total_per_s DESC limit 30;1
2
3
4
5
6
7
8
View packet loss when the server writes to ClickHouse:
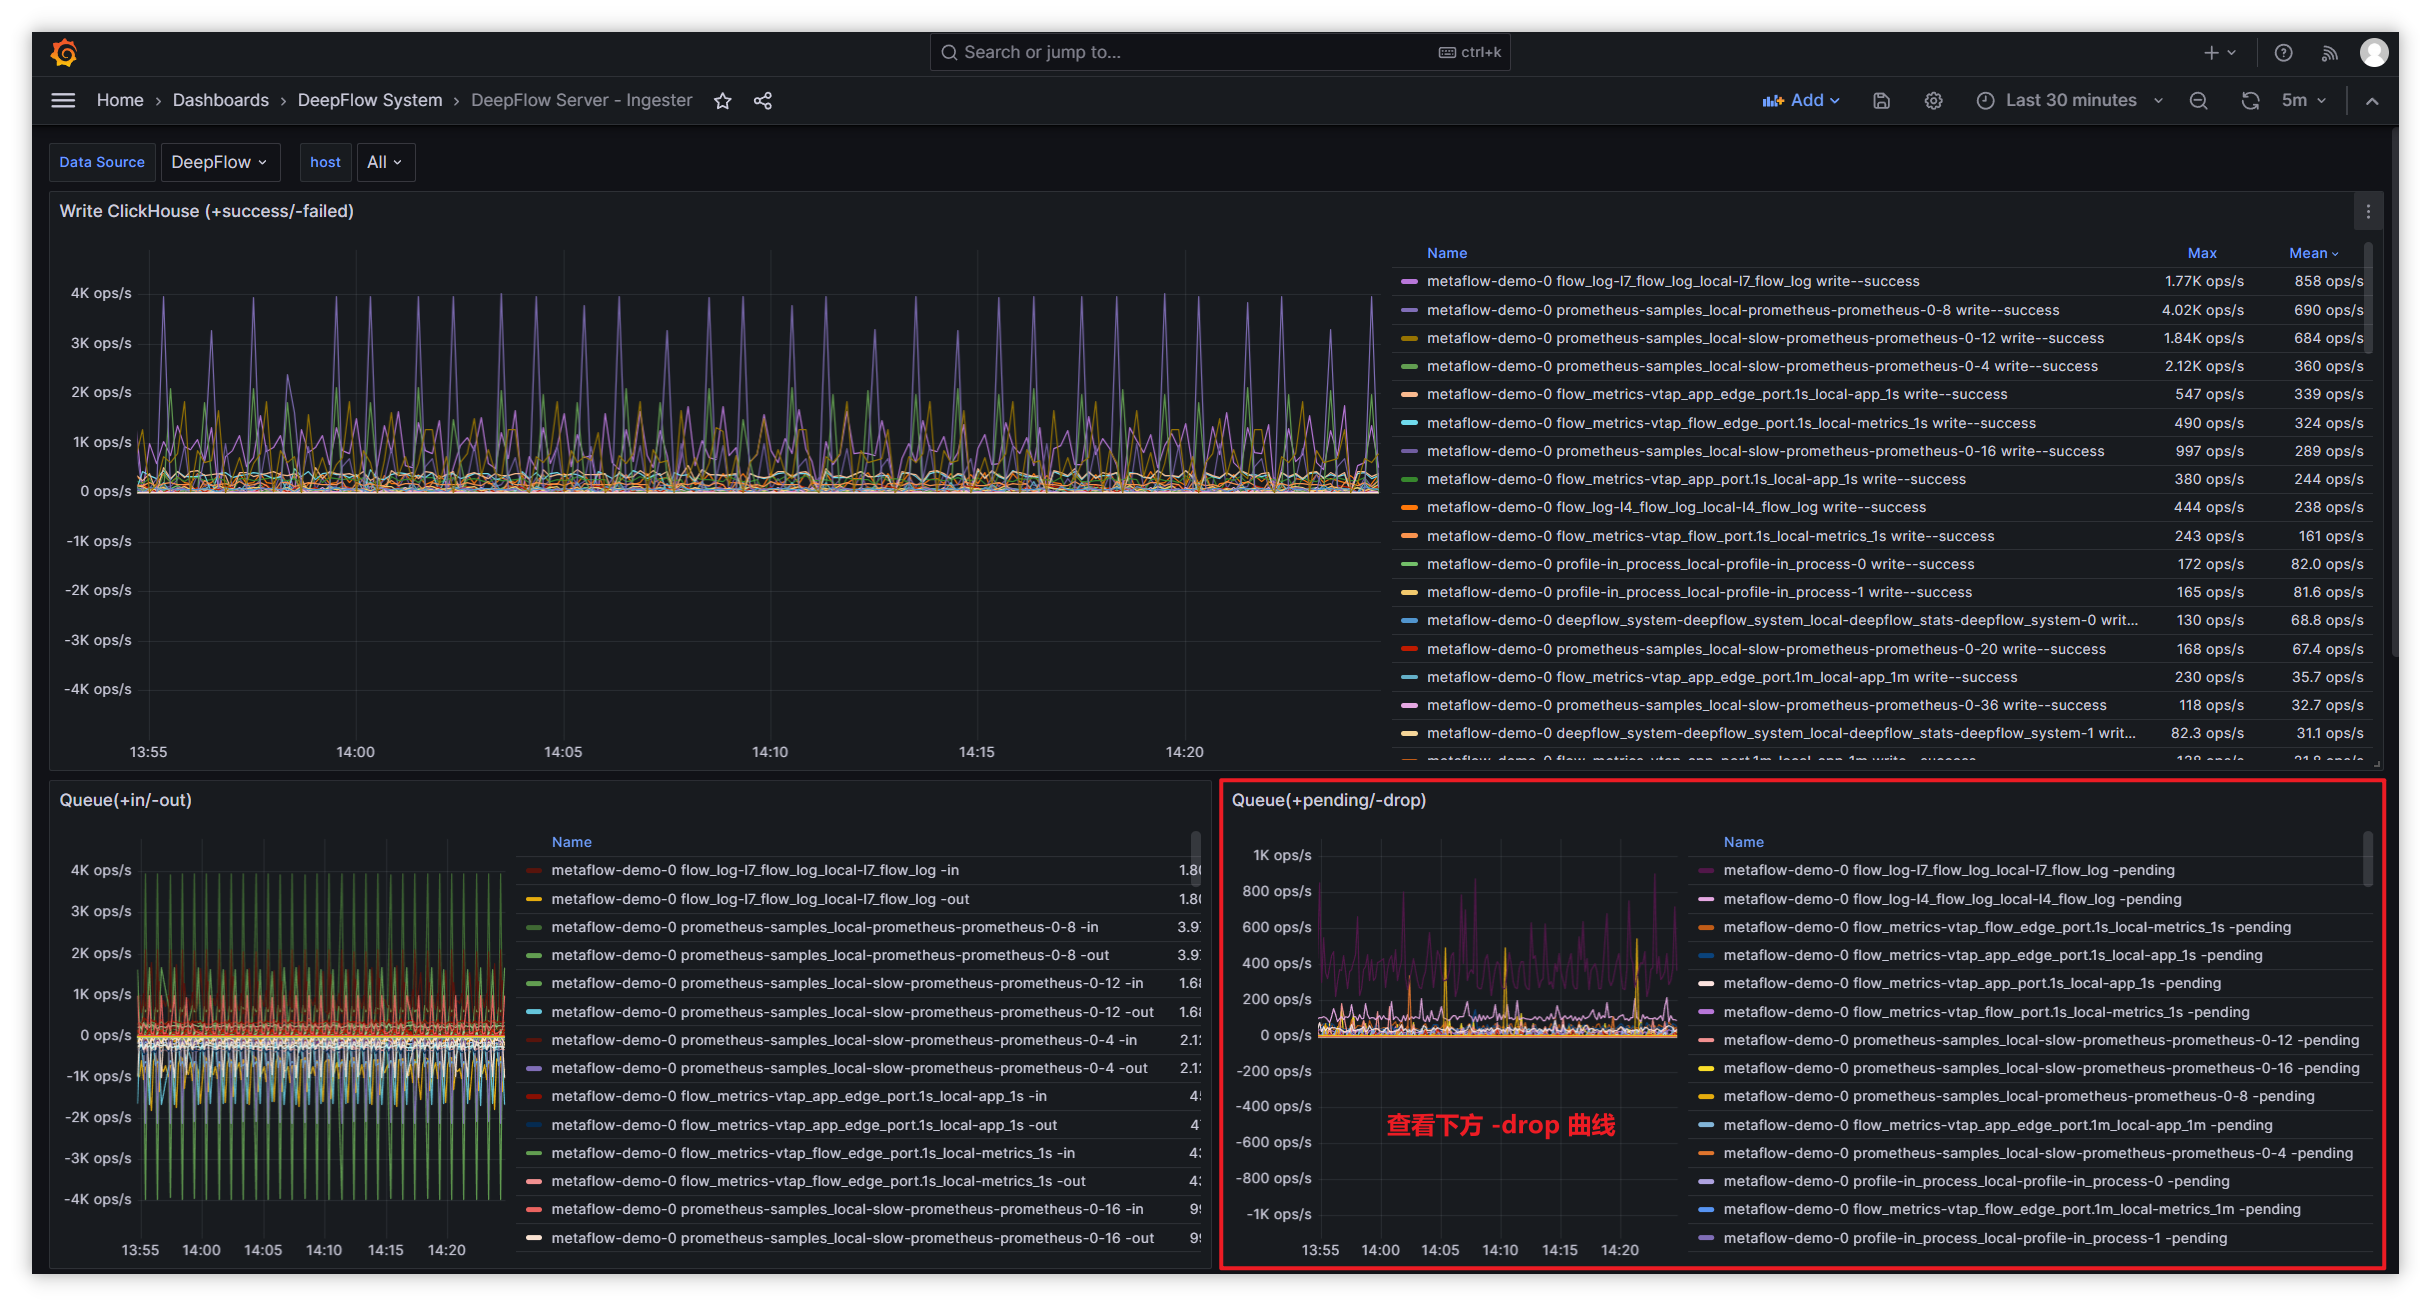
|   Queue Name                                             |   Queue Count Config                  |   Queue Length Config                    |   Queue Description           |
|   ---                                                    |   ----                                |          ---                              |    ----                       |
|   1-recv-unmarshall                                      |   unmarshall-queue-count              |          unmarshall-queue-size            |    Metrics data processing queue |
|   1-receive-to-decode-l4/l7                              |   flow-log-decoder-queue-count        |          flow-log-decoder-queue-size      |    Flow log processing queue   |
|   1-receive-to-decode-telegraf/prometheus/deepflow_stats |   ext-metrics-decoder-queue-count     |          ext-metrics-decoder-queue-size   |    Other data processing queue |
|   1-receive-to-decode-profile                            |   profile-decoder-queue-count         |          profile-decoder-queue-size       |    Performance analysis data processing queue |
|   1-receive-to-decode-proc_event                         |   perf-event-decoder-queue-count      |          perf-event-decoder-queue-size    |    IO and other event processing queue |
|   1-receive-to-decode-raw_pcap                           |   pcap-queue-count                    |          pcap-queue-size                  |    pcap packet processing queue |
|   flow_metrics- prefix                                   |   metrics-ck-writer->queue-count      |          metrics-ck-writer->queue-size    |    Metrics data write queue    |
|   flow_log-l7_packet prefix                              |   pcap-ck-writer->queue-count         |          pcap-ck-writer->queue-size       |    pcap data write queue       |
|   flow_log- prefix except flow_log-l7_packet             |   flowlog-ck-writer->queue-count      |          flowlog-ck-writer->queue-size    |    Flow log data write queue   |
|   ext_metrics- prefix                                    |   ext_metrics-ck-writer->queue-count  |          ext_metrics-ck-writer->queue-size|    Other data write queue      |
|   profile- prefix                                        |   profile-ck-writer->queue-count      |          profile-ck-writer->queue-size    |    Performance analysis data write queue |
Handling other types of packet loss:
Type Metric Set Metric Queue packet loss ingester.queue metrics.overwritten Flow log sampling loss ingester.decoder metrics.drop_count Data write loss ingester.ckwriter metrics.write_failed_count Invalid data loss ingester.recviver metrics.invalid - Handling flow log sampling loss:
- View the corresponding queue packet loss in the
flow log(throttle-drop)Panel in Dashboard: DeepFlow Server - Ingester. - By default, L4/L7 flow log processing is 50,000/s. If CPU, memory, and disk are sufficient, you can increase the throttle to improve processing capacity.
- Adjust the configuration parameters of the Ingester (opens new window) module on the data node to increase processing capacity and avoid packet loss.
- View the corresponding queue packet loss in the
- Handling data write loss:
- Filter server logs for
write block failedto check the reason for write failures. - If using PV, check whether the backend storage still has available space.
- If using hostPath, check whether the local disk still has available space.
- Filter server logs for
- Handling invalid data loss:
- Filter server logs for
TCP clientto obtain the IP address of the invalid data sender.- If sent by DeepFlow-Agent, verify that the DeepFlow-Agent and DeepFlow-Server versions match.
- If not sent by DeepFlow-Agent, block that IP from sending data to the data node's listening port (default: 30033), or raise the alert threshold to suppress alerts caused by such IPs sending data.
- Filter server logs for
- Handling flow log sampling loss:
#2. Introduction
Through Golang Profile (opens new window), we can capture and analyze DeepFlow Server's data write performance for optimization.
#3. Steps
- Install the deepflow-ctl tool.
- Find the Pod IP of the DeepFlow Server to be analyzed with Profile. If the number of DeepFlow Server replicas is greater than 1, select any one of them:
deepflow_server_pod_ip=$(kubectl -n deepflow get pods -o wide | grep deepflow-server | awk '{print $6}')
- Enable the Profile feature:
deepflow-ctl -i $deepflow_server_pod_ip ingester profiler on
#4. Get CPU Profile
go tool pprof http://$deepflow_server_pod_ip:9526/debug/pprof/profile
After executing the command, the default sampling time is 30s. You can modify the Profile duration by adding the seconds=x parameter, e.g., http://$deepflow_server_pod_ip:9526/debug/pprof/profile?seconds=60. After the Profile ends, you can enter the svg command to generate a vector graphic of the Profile result and copy it locally to view in a browser.
#5. Get Memory Profile
go tool pprof http://$deepflow_server_pod_ip:9526/debug/pprof/heap
After executing the command, real-time sampling will be performed to obtain the current memory snapshot. Similarly, you can enter the svg command to generate a vector graphic of the Profile result and copy it locally to view in a browser.
#6. Other Profile Information
If you want to obtain other Profile information, you can find all available analysis types in the Golang SourceCode (opens new window).